
If 25% of your strategic initiatives fail or fall behind schedule, misaligned KPIs are likely to blame. Leadership teams struggle to translate ambitious goals into actionable metrics that truly drive performance. This guide provides a proven, stepwise framework to align KPIs with strategy, accelerate execution through agile sprint planning, and transform organizational results through data-driven decision-making. You'll learn to avoid common pitfalls while building accountability and measurable improvement across every level of your company.
Table of Contents
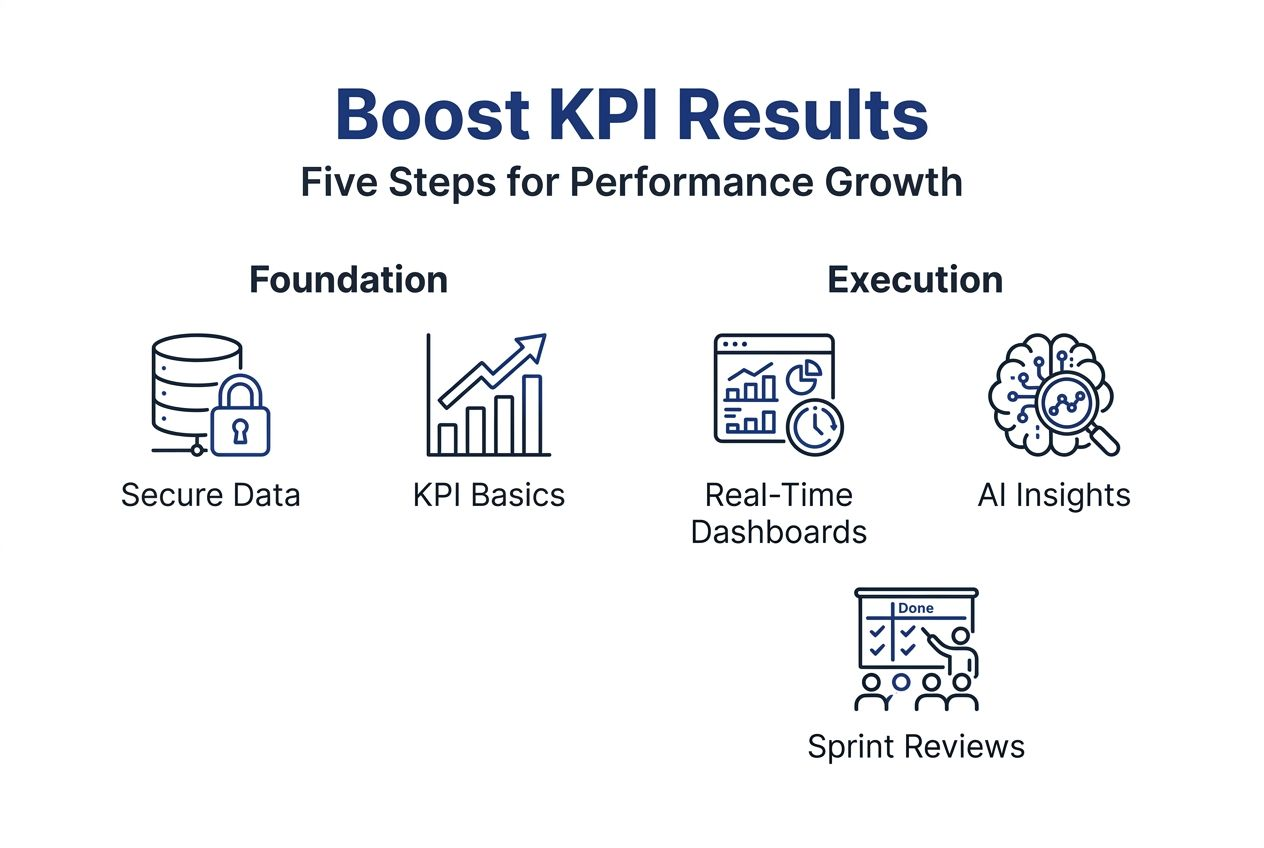
- Prerequisites: Establishing Secure And Compliant Infrastructure
- Step 1: Define Strategic KPIs Aligned With Business Goals
- Step 2: Implement Real-Time KPI Monitoring With Role-Based Access
- Step 3: Integrate AI-Powered Insights For Strategic Decision-Making
- Step 4: Utilize Sprint Planning And Automation To Drive Performance
- Step 5: Conduct Regular Reviews And Retrospectives
- Common Mistakes And Troubleshooting In KPI Management
- Alternative Approaches And Tradeoffs
- Expected Results And Measurable Outcomes
- Discover Outsprinter For Agile KPI Management
Key takeaways
| Point | Details |
|---|---|
| Cascade KPIs from strategic goals | Align metrics across all organizational levels to ensure every team drives toward the same outcomes. |
| Deploy role-based dashboards | Real-time, customized views reduce decision lag and prevent information overload for executives and teams. |
| Integrate AI for forecasting | Predictive insights enhance trend analysis and early risk detection without replacing executive judgment. |
| Link KPIs to sprint cycles | Agile execution frameworks accelerate initiative delivery by up to 40% through automation and retrospectives. |
| Schedule quarterly reviews | Regular evaluation cycles increase strategic success rates by 38% and maintain continuous alignment. |
Prerequisites: establishing secure and compliant infrastructure
Before diving into KPI selection and deployment, you need foundational infrastructure that protects data and ensures cross-functional readiness. Without these prerequisites, even well-designed KPIs will struggle to deliver reliable insights or gain organizational trust.
Start with security and compliance. Bank-grade encryption and GDPR compliance aren't optional when handling performance data that reveals strategic priorities, financial metrics, and operational vulnerabilities. Leadership teams must trust that sensitive KPI information remains protected from unauthorized access.
Next, ensure your executive team understands core KPI concepts. Familiarity with terms like leading versus lagging indicators, threshold settings, and cascade logic accelerates adoption and reduces implementation friction. If your leadership needs a refresher, invest time upfront to align on vocabulary and frameworks.
Standardize data input processes across departments. Inconsistent measurement methods, varied reporting formats, or siloed data sources create unreliable KPI dashboards that erode confidence. Establish clear protocols for how teams collect, validate, and submit performance data.
Finally, commit to regular review cadences. KPI frameworks only succeed when leadership actively monitors progress and adjusts course. Schedule recurring evaluation sessions before you launch dashboards to build accountability into your organizational rhythm.
- Verify encryption protocols meet banking industry standards for data at rest and in transit
- Conduct leadership training on KPI fundamentals and dashboard navigation before rollout
- Document standardized data collection procedures with department-specific examples and templates
- Block calendar time for quarterly reviews and monthly check-ins to sustain momentum
Pro Tip: Assign a cross-functional data steward to audit input quality monthly and flag inconsistencies early before they compound into unreliable trends.
Step 1: define strategic KPIs aligned with business goals
With infrastructure in place, focus on selecting KPIs that directly reflect your strategic objectives. The most common mistake executives make is tracking too many metrics, diluting focus and creating noise that obscures critical signals.
Limit your strategic KPIs to a focused set that measures critical success factors. Research shows companies should track between 5 and 15 top-level KPIs to maintain clarity. Each KPI should answer a specific question about strategic progress: Are we growing revenue? Improving efficiency? Retaining customers?
Ensure your KPIs cascade from top-level goals to departmental objectives. If your company targets 30% revenue growth, sales KPIs should measure pipeline velocity and conversion rates, while marketing tracks qualified lead generation and cost per acquisition. Every team's metrics should roll up to support the strategic target.
Use established frameworks that link metrics with measurable outcomes. The most effective KPIs specify both the metric and the threshold that indicates success. Instead of vague goals like "improve customer satisfaction," define "maintain Net Promoter Score above 50 with quarterly measurement."
Avoid the misconception that more metrics equal better insights. Many KPIs fail because they measure activity rather than outcomes or lack clear ownership and accountability. Each KPI should have a designated owner responsible for monitoring, reporting, and improvement actions.
- Map each strategic goal to 2 to 3 specific KPIs that measure progress toward that objective
- Define clear thresholds using green, yellow, and red zones to signal performance status at a glance
- Assign individual executives as KPI owners with explicit accountability for results and corrective actions
- Review KPI relevance quarterly and retire metrics that no longer align with evolving strategic priorities
Step 2: implement real-time KPI monitoring with role-based access
Once you've defined your KPIs, deploy dashboards that make performance data accessible and actionable. Real-time visibility reduces decision lag and enables faster course correction when metrics trend unfavorably.

Real-time dashboards transform how quickly leadership can respond to emerging issues. Traditional monthly reports arrive too late to prevent problems from escalating. Continuous monitoring lets you spot a sudden drop in conversion rates or customer satisfaction within days, not weeks, giving you time to intervene.
Role-based access prevents distraction by filtering irrelevant data from each user's view. CEOs need high-level strategic KPIs across all departments, managers require detailed metrics for their teams, and individual contributors benefit from task-level performance indicators. Lack of role-based access controls leads to data overwhelm and distracts 50% of users from core metrics.
Tailor visualizations to match how different roles consume information. Executives prefer trend lines and strategic scorecards, managers need drill-down capabilities to diagnose issues, and viewers want simplified dashboards that answer specific questions without complexity. High-performing teams use KPIs differently based on their decision authority and operational scope.
Implement security best practices that maintain data integrity and confidentiality. Audit logs should track who accesses sensitive KPI data, when they view it, and what actions they take. Limit editing permissions to data stewards and KPI owners to prevent unauthorized modifications.
- Configure CEO dashboards to display only top 10 strategic KPIs with year-over-year comparisons and trend indicators
- Build manager views that link departmental KPIs to underlying task completion rates and team capacity metrics
- Create viewer dashboards that show personal contribution to team KPIs without exposing sensitive financial data
- Enable mobile access for executives who need KPI visibility during travel or between meetings
Pro Tip: Schedule a 30-minute dashboard walkthrough with each role group during rollout to demonstrate filtering, drill-down features, and alert settings tailored to their needs.
Step 3: integrate AI-powered insights for strategic decision-making
After establishing real-time dashboards, layer in AI analytics to enhance forecasting accuracy and identify patterns human analysis might miss. AI doesn't replace executive judgment but augments it with predictive insights that inform smarter strategic pivots.
AI increases forecasting accuracy by approximately 25%, helping leadership anticipate future performance based on historical trends and leading indicators. Instead of reacting to lagging metrics after problems materialize, you can spot early warning signals and adjust tactics proactively.
Data-driven insights reveal emerging risks and opportunities that aren't obvious from raw numbers alone. AI algorithms detect correlations between seemingly unrelated metrics, such as how customer support ticket volume predicts churn risk or how employee engagement scores forecast productivity changes.
AI should augment executive decision-making, not automate it. Algorithms excel at pattern recognition and probability estimation but lack the contextual understanding, industry experience, and strategic vision that CEOs bring. Use AI to surface insights, then apply your judgment to determine appropriate responses.
Leaders gain deeper trend analysis to inform strategic pivots. AI tools can simulate how changes in one KPI might cascade through related metrics, helping you evaluate potential decisions before committing resources. This scenario planning capability reduces the risk of unintended consequences.
Choose AI tools that integrate seamlessly with your existing KPI dashboards. Standalone analytics platforms create workflow friction and reduce adoption. The best solutions embed predictive insights directly into the dashboards your team already uses daily.
- Enable AI-powered anomaly detection to alert leadership when KPIs deviate significantly from expected ranges or historical patterns
- Use machine learning models to forecast quarterly performance based on current trajectory and seasonality factors
- Implement correlation analysis to identify which leading indicators most reliably predict your critical lagging KPIs
- Test AI recommendations against executive intuition to calibrate confidence in algorithmic insights over time
For practical implementation, refer to our weekly KPI tracking guide that shows how frequent monitoring enhances AI model accuracy.
Step 4: utilize sprint planning and automation to drive performance
With KPIs defined, monitored, and enhanced by AI, operationalize them through agile sprint cycles that link strategic metrics to tactical execution. Sprint planning accelerates initiative delivery by 40% by breaking ambitious goals into manageable weekly or biweekly increments.
Transform your KPI framework from measurement tool into execution engine. Here's how to structure sprint-based performance management:
- Align each sprint cycle to specific KPI improvement targets, such as increasing pipeline by 15% or reducing support ticket resolution time by 20%.
- Break strategic KPI goals into tactical tasks that teams can complete within a single sprint, creating clear cause-and-effect relationships.
- Automate recurring sprint setup so teams maintain consistent execution rhythms without manual administrative overhead each cycle.
- Track sprint completion rates and velocity as operational KPIs that indicate whether you're building sufficient capacity to hit strategic targets.
- Conduct retrospectives after each sprint to identify process improvements and remove barriers slowing KPI progress.
Automation ensures recurring sprint cycles maintain KPI focus without requiring constant manual intervention. Template-based sprint creation, automated task assignment based on role, and scheduled retrospective prompts keep teams aligned to performance goals.
Retrospective documentation supports iterative process improvements. When teams systematically capture what worked, what didn't, and what to change, they compound learning across sprints. This continuous improvement loop directly impacts how effectively KPIs change team behavior and drive accountability.
Align tactical work directly to strategic KPIs to maintain agility. Every sprint task should trace back to a specific KPI it's designed to improve. If tasks don't connect to performance metrics, question whether they deserve priority.
| Sprint Element | Purpose | KPI Connection |
|---|---|---|
| Sprint Goal | Define specific outcome | Map to 1-2 strategic KPIs |
| Task Breakdown | Assign actionable work | Link to operational sub-metrics |
| Daily Standups | Remove blockers quickly | Maintain sprint velocity KPI |
| Retrospective | Capture improvement ideas | Feed process efficiency KPIs |
Pro Tip: Set a rule that no sprint can launch without explicitly stating which KPI it targets and how success will be measured. This simple governance mechanism prevents scope creep and maintains strategic focus.
Step 5: conduct regular reviews and retrospectives
Even the best KPI frameworks drift from strategic alignment without scheduled evaluation cycles. Quarterly reviews and retrospectives maintain accountability, identify performance barriers early, and ensure your metrics evolve with changing business priorities.
Quarterly reviews increase strategic success rates by 38% compared to organizations that evaluate performance only annually. The cadence is frequent enough to catch issues before they derail annual plans yet spaced enough to give initiatives time to demonstrate results.
Regular retrospectives promote transparency and accountability across leadership teams. When executives openly discuss what's working and what isn't, they model the data-driven culture required for KPI management to thrive. These sessions should feel constructive, not punitive, focusing on system improvements rather than individual blame.
Review cycles identify and address performance barriers early. Common obstacles include resource constraints, misaligned incentives, unclear ownership, or external market changes that make KPI targets obsolete. Quarterly check-ins create forums to surface these issues and adjust course.
Use threshold color coding to highlight KPI performance status instantly. Green indicates on-track or exceeding targets, yellow signals early warning that intervention may be needed, and red demands immediate attention. Visual status makes it easy to prioritize discussion during reviews. Learn more about setting effective KPI thresholds that drive appropriate urgency.
Sustain continuous alignment between initiatives and strategic goals. Markets shift, competitive landscapes evolve, and internal capabilities develop. Your KPI framework should flex accordingly, retiring metrics that no longer matter and introducing new ones that reflect emerging priorities.
- Schedule 90-minute quarterly reviews with executive teams to evaluate strategic KPI progress and adjust targets or resources
- Conduct 30-minute sprint retrospectives immediately after each cycle ends to capture fresh insights while context is clear
- Require every red or yellow KPI to have a documented action plan with owner and deadline before concluding reviews
- Archive review notes and decisions in a searchable repository to track how KPI strategy evolves over time
Common mistakes and troubleshooting in KPI management
Even experienced leadership teams encounter predictable pitfalls when implementing KPI frameworks. Recognizing these patterns helps you avoid costly missteps and recover quickly when issues emerge.
Tracking too many KPIs dilutes focus and reduces execution quality. When teams monitor 30 or 40 metrics, they lose the ability to prioritize. Everything becomes equally important, which means nothing receives concentrated effort. Avoid KPI overload by limiting strategic dashboards to your most critical 5 to 15 measures.
Inconsistent data inputs lead to unreliable KPI reports. If sales tracks opportunities one way, marketing another, and finance a third, your pipeline KPI becomes meaningless. Invest in data governance, standardized definitions, and validation protocols that ensure apples-to-apples comparisons.
Lack of cross-department KPI alignment causes delays and finger-pointing. When sales targets customer acquisition but operations optimizes for cost reduction, they work at cross-purposes. Every department's KPIs should complement rather than conflict with others.
Overexposure to irrelevant KPIs distracts users from priorities. Individual contributors don't need visibility into company-wide financial metrics that they can't influence. Give each role access only to KPIs relevant to their scope of control.
Implement governance processes that prevent these common failures. Establish a KPI review board that approves new metrics, retires outdated ones, and ensures cross-functional alignment. Simplify dashboards ruthlessly, removing any metric that doesn't directly inform decisions. Run quarterly alignment workshops where departments present their KPIs and discuss interdependencies to surface conflicts early.
- Audit your current KPI list and eliminate any metric that hasn't informed a decision in the past quarter
- Create a single source of truth data dictionary that defines how each KPI is calculated and sourced
- Map KPI dependencies between departments to identify where misalignment could create bottlenecks
- Survey dashboard users quarterly to identify which metrics they find most and least valuable
Alternative approaches and tradeoffs
KPI management isn't one size fits all. Different methodologies suit different organizational cultures, strategic priorities, and operational tempos. Understanding alternatives helps you make informed choices about which approach best serves your needs.
Balanced scorecards offer broader strategic perspective by measuring performance across four dimensions: financial, customer, internal processes, and learning and growth. This holistic view prevents overemphasis on short-term financial results at the expense of long-term capabilities. However, balanced scorecards typically operate on quarterly or annual cycles, providing slower feedback than sprint-based approaches.
Sprint-based KPI management provides fast, agile feedback linked directly to execution. By reviewing performance every one to two weeks, teams spot issues quickly and adjust tactics in near real-time. This approach excels in dynamic environments where rapid iteration drives competitive advantage. The tradeoff is that frequent cycles can feel overwhelming if governance processes aren't streamlined.
Objectives and Key Results (OKRs) emphasize ambitious goal setting and transparent progress tracking. Unlike traditional KPIs that measure ongoing operations, OKRs focus on transformational initiatives with quarterly timeframes. They work well for innovation-driven priorities but may underemphasize operational excellence metrics that balanced scorecards or KPI dashboards capture.
| Approach | Strategic Breadth | Feedback Speed | Best For |
|---|---|---|---|
| Balanced Scorecard | Comprehensive (4 dimensions) | Quarterly | Long-term strategic balance |
| Sprint-Based KPIs | Focused execution | Weekly/Biweekly | Agile, fast-moving markets |
| OKRs | Transformational goals | Quarterly | Innovation and growth phases |
| Traditional KPIs | Operational metrics | Monthly | Stable, process-driven operations |
Situational suitability depends on your organization's priorities and culture. Fast-growing startups often favor sprint-based or OKR approaches that support rapid experimentation. Mature enterprises may prefer balanced scorecards that ensure no strategic dimension gets neglected. Many organizations blend approaches, using balanced scorecards for strategic planning, sprint-based KPIs for execution, and OKRs for breakthrough initiatives.
Choose the approach aligned with your desired pace and scope of performance management. If your competitive advantage depends on speed and adaptability, prioritize frameworks with tight feedback loops. If strategic balance and long-term capability building matter most, invest in comprehensive measurement systems even if they respond more slowly.
Expected results and measurable outcomes
Implementing the KPI management framework outlined in this guide delivers quantifiable improvements across multiple dimensions of organizational performance. Setting realistic expectations helps you evaluate success and maintain momentum through the implementation journey.
Implementation typically spans 3 to 6 months for full impact. The first 30 days focus on KPI definition, data infrastructure setup, and dashboard configuration. Months two and three involve pilot testing with select teams, refining role-based access, and training users. By month four, you'll see early performance trends, with full benefits materializing by month six as processes mature.
Operational efficiency gains average 20% within the first year. Real-time visibility eliminates time wasted searching for performance data, redundant reporting, and meetings spent debating what the numbers actually mean. Teams redirect this reclaimed capacity toward high-value work.
KPI alignment improvements reduce project delays by 25%. When every department's metrics cascade from shared strategic goals, cross-functional initiatives experience fewer miscommunications and conflicting priorities. Resources flow more smoothly to highest-impact work.
Sprint planning accelerates initiative execution by 40%. Breaking strategic goals into weekly tactical sprints creates urgency, maintains focus, and surfaces blockers quickly before they compound. The combination of clear targets and rapid feedback loops dramatically improves delivery velocity.
Quarterly reviews correlate with 38% higher strategic target achievement. Regular evaluation cycles ensure leadership notices early warning signals, adjusts tactics proactively, and maintains organizational focus on what matters most.
- Expect to see first meaningful KPI trend data within 30 to 45 days after dashboard launch
- Plan for 10 to 15% of KPIs to require refinement or replacement after the first quarter based on usage patterns | Allocate budget for ongoing training as new team members join or roles evolve |
- Set aside executive time for monthly KPI governance meetings to maintain framework quality and relevance
Discover Outsprinter for agile KPI management
You've learned the framework for transforming organizational performance through strategic KPI management. Now it's time to put these principles into action with tools designed specifically for executive teams who demand both simplicity and power.
Outsprinter delivers everything covered in this guide: real-time dashboards with role-based access, AI-powered insights that enhance forecasting, automated sprint planning that links KPIs to execution, and retrospective tools that drive continuous improvement. The platform handles the complexity of data integration and visualization while keeping the user experience intuitive for time-constrained executives.
Role-based dashboards ensure CEOs see strategic metrics, managers focus on team performance, and contributors track personal impact without distraction. AI algorithms surface trends and anomalies automatically, so you spend less time analyzing spreadsheets and more time making decisions. Sprint automation maintains consistent execution rhythms that accelerate how quickly strategic goals translate into results.
Flexible pricing plans scale from growing teams to enterprise deployments, ensuring you only pay for the capabilities and user seats your organization needs right now.
FAQ
What are the most critical KPIs for B2B executive teams?
Focus on KPIs aligned to revenue growth (pipeline velocity, win rates), customer acquisition (cost per acquisition, qualified leads), operational efficiency (project completion rates, resource utilization), and strategic milestones (market share, product launches). The most effective executive KPIs cascade across departments, ensuring every team's metrics ladder up to support these top-level outcomes.
How often should leadership teams review KPIs to ensure alignment?
Quarterly reviews strike the optimal balance between responsiveness and stability, giving initiatives enough time to demonstrate meaningful progress while catching issues before they derail annual plans. Supplement quarterly strategic reviews with monthly operational check-ins and weekly sprint retrospectives to maintain continuous alignment across all organizational levels.
What common mistakes should be avoided in KPI implementation?
Avoid tracking too many KPIs, which dilutes focus and prevents teams from prioritizing effectively. Ensure data consistency by standardizing measurement methods and input protocols across departments. Implement role-based access controls to reduce information overload and keep users focused on metrics within their scope of influence. Finally, assign clear ownership for every KPI to maintain accountability.
Can AI replace executive decision-making in KPI management?
AI enhances forecasting accuracy by approximately 25% and excels at pattern recognition, but it cannot replace human strategic oversight. Executives bring contextual understanding, industry experience, ethical judgment, and stakeholder considerations that algorithms lack. Use AI to surface insights and scenario predictions, then apply your judgment to determine appropriate strategic responses based on the full picture.