
TL;DR:
- Choosing the wrong KPIs can lead to wasted effort and missed opportunities for meaningful improvement.
- Effective KPI management requires a clear taxonomy aligned with organizational decision cycles, ensuring relevant metrics drive action across all levels.
Choosing the wrong KPIs is one of the most expensive mistakes a business can make. Teams end up chasing numbers that look good in reports but change nothing on the ground, while the metrics that actually predict success get ignored. The result is a performance review culture that breeds frustration instead of accountability. This guide walks you through every major KPI type, explains the frameworks that help you choose wisely, and gives you practical tools to build a measurement system your teams can actually act on.
Table of Contents
- Understanding KPI types: Key frameworks for business performance
- Strategic vs operational KPIs: Where and how they drive results
- Leading vs lagging indicators: Predictive insight vs retrospective tracking
- Value chain KPIs: Input, process, output, and outcome indicators
- Functional KPIs: Measuring success in different departments
- A fresh perspective: Why actionable KPIs matter more than their category
- Optimize KPI results with Outsprinter's management tools
- Frequently asked questions
Key Takeaways
| Point | Details |
|---|---|
| Know your KPI types | Understanding all major KPI types helps you track what matters at every organizational level. |
| Balance leading and lagging | Combining predictive and retrospective KPIs gives a full picture and improves course-correction. |
| Prioritize actionable metrics | Choose KPIs your team can influence, with clear owners and precise definitions to drive real decisions. |
| Use value chain thinking | Apply input, process, output, and outcome KPIs to monitor efficiency and results from start to finish. |
| Leverage technology for tracking | Platforms like Outsprinter streamline KPI management, making tracking and ownership easier for business leaders. |
Understanding KPI types: Key frameworks for business performance
Before you can pick the right KPIs, you need a map of the territory. Most organizations make the mistake of treating all KPIs as equal, mixing long-term health metrics with daily operational numbers and wondering why their reviews feel disconnected from reality.
KPI types can be categorized by time horizon and decision use (strategic vs operational) and by where they sit in the organization (functional). That single distinction alone can prevent hours of wasted reporting each month. Add a second layer, the value chain perspective (input, process, output, outcome), and you have a complete taxonomy for designing a measurement system that serves every level of your organization.
Here are the core frameworks every performance manager should know:
- Strategic KPIs: High-level, long-term metrics that reflect organizational health.
- Operational KPIs: Short-cycle metrics tied to daily or weekly execution.
- Functional KPIs: Department-specific metrics aligned to local responsibilities.
- Leading indicators: Forward-looking metrics that predict what will happen.
- Lagging indicators: Backward-looking metrics that confirm what already happened.
- Value chain KPIs: Metrics at each stage of how your organization creates value (input, process, output, outcome).
Understanding boosting KPI results starts with this clarity. Without a taxonomy, teams tend to pick metrics that are easy to measure rather than metrics that matter. The taxonomy forces a discipline: every proposed KPI must fit somewhere in the map, and if it doesn't, you need to ask whether it belongs at all.
The practical benefit of this approach is that it prevents the most common pitfall in KPI management strategies: metric sprawl. When every department adds metrics without a shared framework, you end up with fifty KPIs that tell fifty different stories and no coherent picture of performance.
Pro Tip: Build your KPI taxonomy to match your organization's actual decision flow. If your executive team meets quarterly, strategic KPIs should report quarterly. If your operations team reviews daily, operational KPIs need daily visibility. Mismatching the reporting cadence to the decision cycle is what makes dashboards feel useless.
Strategic vs operational KPIs: Where and how they drive results
Strategic KPIs exist to answer one question: is the organization moving in the right direction? Strategic KPIs include overall health measures like revenue and market share, while operational KPIs focus on specific processes and locations with much shorter timeframes.

Here's how the two types compare in practice:
| Dimension | Strategic KPIs | Operational KPIs |
|---|---|---|
| Scope | Whole organization | Process or team level |
| Frequency | Monthly or quarterly | Daily or weekly |
| Primary users | Executives, board | Managers, team leads |
| Sample metrics | Revenue growth, market share, NPS | Order cycle time, first-call resolution, task completion rate |
| Decision type | Direction, investment, strategy | Execution, adjustment, intervention |
Knowing which type to use in which context matters more than most leaders realize. Presenting operational metrics in a board review wastes everyone's time. Tracking only strategic KPIs at the team level leaves managers without the signals they need to fix problems before they escalate.
Strengths and limitations of each type:
Strategic KPIs:
- Strong for alignment and investor communication
- Reveal long-term trends and business health
- Often lag behind reality (slow to reflect operational changes)
- Can feel abstract to frontline teams
Operational KPIs:
- Actionable and close to the work
- Fast feedback loops for managers
- Risk metric overload if too many are tracked
- Can create local optimization at the expense of strategic goals
The KPI selection challenges most organizations face come down to this imbalance. Companies that track only strategic KPIs can't diagnose what's going wrong until it's too late. Companies that track only operational KPIs often lose sight of whether all that execution is actually moving the business forward. The answer is to use both, deliberately, with clear links between them.
A strong practice is to cascade your strategic KPIs down into operational ones. If a strategic goal is to grow revenue by 20%, the operational KPIs underneath it might include lead response time, proposal win rate, and average deal cycle length. Each operational metric becomes a lever your team can actually pull.
Leading vs lagging indicators: Predictive insight vs retrospective tracking
One of the most practically valuable distinctions in performance management is the difference between leading and lagging indicators. KPIs are often divided into leading vs lagging indicators: leading indicators predict future outcomes, while lagging indicators confirm past results.
| Indicator type | Example metrics | Best decision use |
|---|---|---|
| Leading | Sales pipeline value, employee engagement score, new qualified leads | Early intervention, resource allocation, forecasting |
| Lagging | Quarterly revenue, annual churn rate, net promoter score | Performance review, accountability, trend analysis |
| Combined | Pipeline to revenue ratio, engagement to retention correlation | Full picture management, predictive accountability |
Combining leading and lagging provides a complete picture: leading indicators offer early warning signals, and lagging indicators confirm objective attainment.
Here's how to balance them effectively:
- Identify your key lagging indicators first. These are the outcomes you ultimately care about: revenue, churn, customer satisfaction scores.
- Work backward to find leading indicators. Ask what behaviors or activities reliably predict each lagging outcome. Pipeline volume predicts revenue. Training completion rates predict quality scores.
- Set targets for both. Don't only celebrate hitting the lagging target. Reward teams for consistently executing the leading behaviors.
- Review leading indicators weekly. They exist to give you time to act. If you only check them monthly, you've lost the advantage.
- Audit the correlation regularly. Leading indicators are only valuable if they actually predict the lagging outcome. Test and refine over time.
"The best-performing teams don't wait for quarterly results to understand performance. They use leading indicators like a dashboard on a moving vehicle: constant, real-time information that helps them steer before they hit a wall."
Knowing how to use KPI tracking ROI depends heavily on this combination. A business tracking only lagging indicators is essentially driving by looking in the rearview mirror. Building weekly KPI tracking around leading indicators gives your team the ability to course-correct in real time, not just reflect on what went wrong last quarter.
Value chain KPIs: Input, process, output, and outcome indicators
The value chain framework applies a different lens. Instead of asking who uses the KPI or when does it tell you something, it asks where in the work does this metric live?
Input KPIs measure resources invested, process KPIs measure efficiency, output KPIs track results delivered, and outcome KPIs capture the broader direction or ultimate impact of the work. Together, they give you a full picture of how resources become results.
Here's what each stage looks like in practice:
- Input KPIs: Budget spent, headcount allocated, training hours delivered, number of raw leads generated.
- Process KPIs: Task completion rate, average handling time, defect rate during production, on-time delivery percentage.
- Output KPIs: Number of products shipped, proposals sent, calls completed, features launched.
- Outcome KPIs: Revenue generated, customer lifetime value, market share change, employee retention rate.
Most organizations over-index on output KPIs because they're easy to count. Shipped products, completed calls, and sent emails are visible and tangible. But output without outcome is activity without impact. Sending 500 proposals means nothing if only 2 convert.
The power of this framework is in chaining the metrics together. If your outcome KPI (revenue) is falling short, you trace it back through the chain. Are outputs sufficient (enough proposals sent)? Is the process efficient (are proposals being completed on time and at quality)? Are inputs adequate (enough qualified leads entering the funnel)? This tracing process turns performance reviews from blame sessions into diagnostic conversations.
Pro Tip: Use outcome KPIs to evaluate success, but use input and process KPIs to drive daily improvement. Outcome metrics tell you where you stand; input and process metrics tell you what to change. When building better KPIs, make sure every team has at least one of each type in their reporting toolkit.
Functional KPIs: Measuring success in different departments
Every department has its own definition of performance. Finance cares about profit margins and cash flow. Sales focuses on conversion rates and quota attainment. Marketing tracks cost per acquisition and campaign ROI. HR monitors employee turnover, time-to-hire, and engagement scores.
Functional KPIs track progress in specific functions like finance, sales, marketing, and HR, giving each team a measurement language that reflects their actual work. The challenge is ensuring those functional metrics connect back to the strategic KPIs at the organizational level.
Here's a practical approach to implementing functional KPIs successfully:
- Start with the team's core mission. Each department should be able to state its purpose in one sentence. The KPIs should directly reflect that mission.
- Assign an owner to each KPI. Every metric needs one person accountable for its accuracy and improvement. Without a named owner, KPIs become shared responsibility, which in practice means no one's responsibility.
- Write precise definitions. Specify what's included and excluded from each calculation. Effective KPI design emphasizes precise definitions, ownership, thresholds, and alignment to the decisions they must inform.
- Set thresholds, not just targets. A target tells you where you want to be. A threshold tells you when to act. Green/yellow/red zones give managers an automatic decision trigger.
- Review relevance quarterly. Business priorities shift. A KPI that was critical six months ago might now be measuring something no longer relevant to your strategy.
"Ambiguous KPIs don't just make reporting harder—they create the illusion of accountability without any real ownership. If two people can compute the same metric two different ways, you have a definition problem, not a performance problem."
Building KPI accountability at the functional level is where most organizations see the biggest gains. Department heads who own clearly defined metrics with agreed thresholds stop arguing about numbers and start acting on them. And setting KPI thresholds properly is what separates a tracking exercise from a management system.
A fresh perspective: Why actionable KPIs matter more than their category
Here's an uncomfortable truth: you can correctly categorize every KPI in your organization, use perfect taxonomy, and still produce a measurement system that does absolutely nothing for performance. The category of a KPI matters far less than whether your team can actually do something about it.
The same KPI can be actionable or unactionable depending on how much control the team has over the metric. A customer satisfaction score might be perfectly strategic and correctly defined, but if the team tracking it has no authority to change product, pricing, or service processes, it's a spectator metric. It tells a story. It doesn't drive action.
This is the honest assessment after exploring all the frameworks: real performance improvement comes from three things that no taxonomy can provide. First, the team must be able to influence the metric. Second, the definition must be so clear that different teams compute the same values rather than arguing over methodology in every review. Third, the threshold must be set at the point where action becomes necessary, not just the point where everyone feels comfortable reporting progress.
Think about KPI clarity this way: a well-categorized metric that no one acts on is organizational decoration. An imperfectly categorized metric that triggers immediate, consistent action from an empowered team is genuine performance management. The frameworks in this guide are essential, but they are tools to reach that second outcome, not ends in themselves.
Pro Tip: Every quarter, audit your KPI list with one question: "What specific decision or action does this metric drive?" If the answer is "it informs leadership" or "it goes in the report," remove it or redesign it. Your KPIs should be forcing functions for behavior, not data points in a presentation.
Optimize KPI results with Outsprinter's management tools
Understanding KPI types is the foundation. Executing on them consistently requires a system that keeps your whole team aligned and accountable.
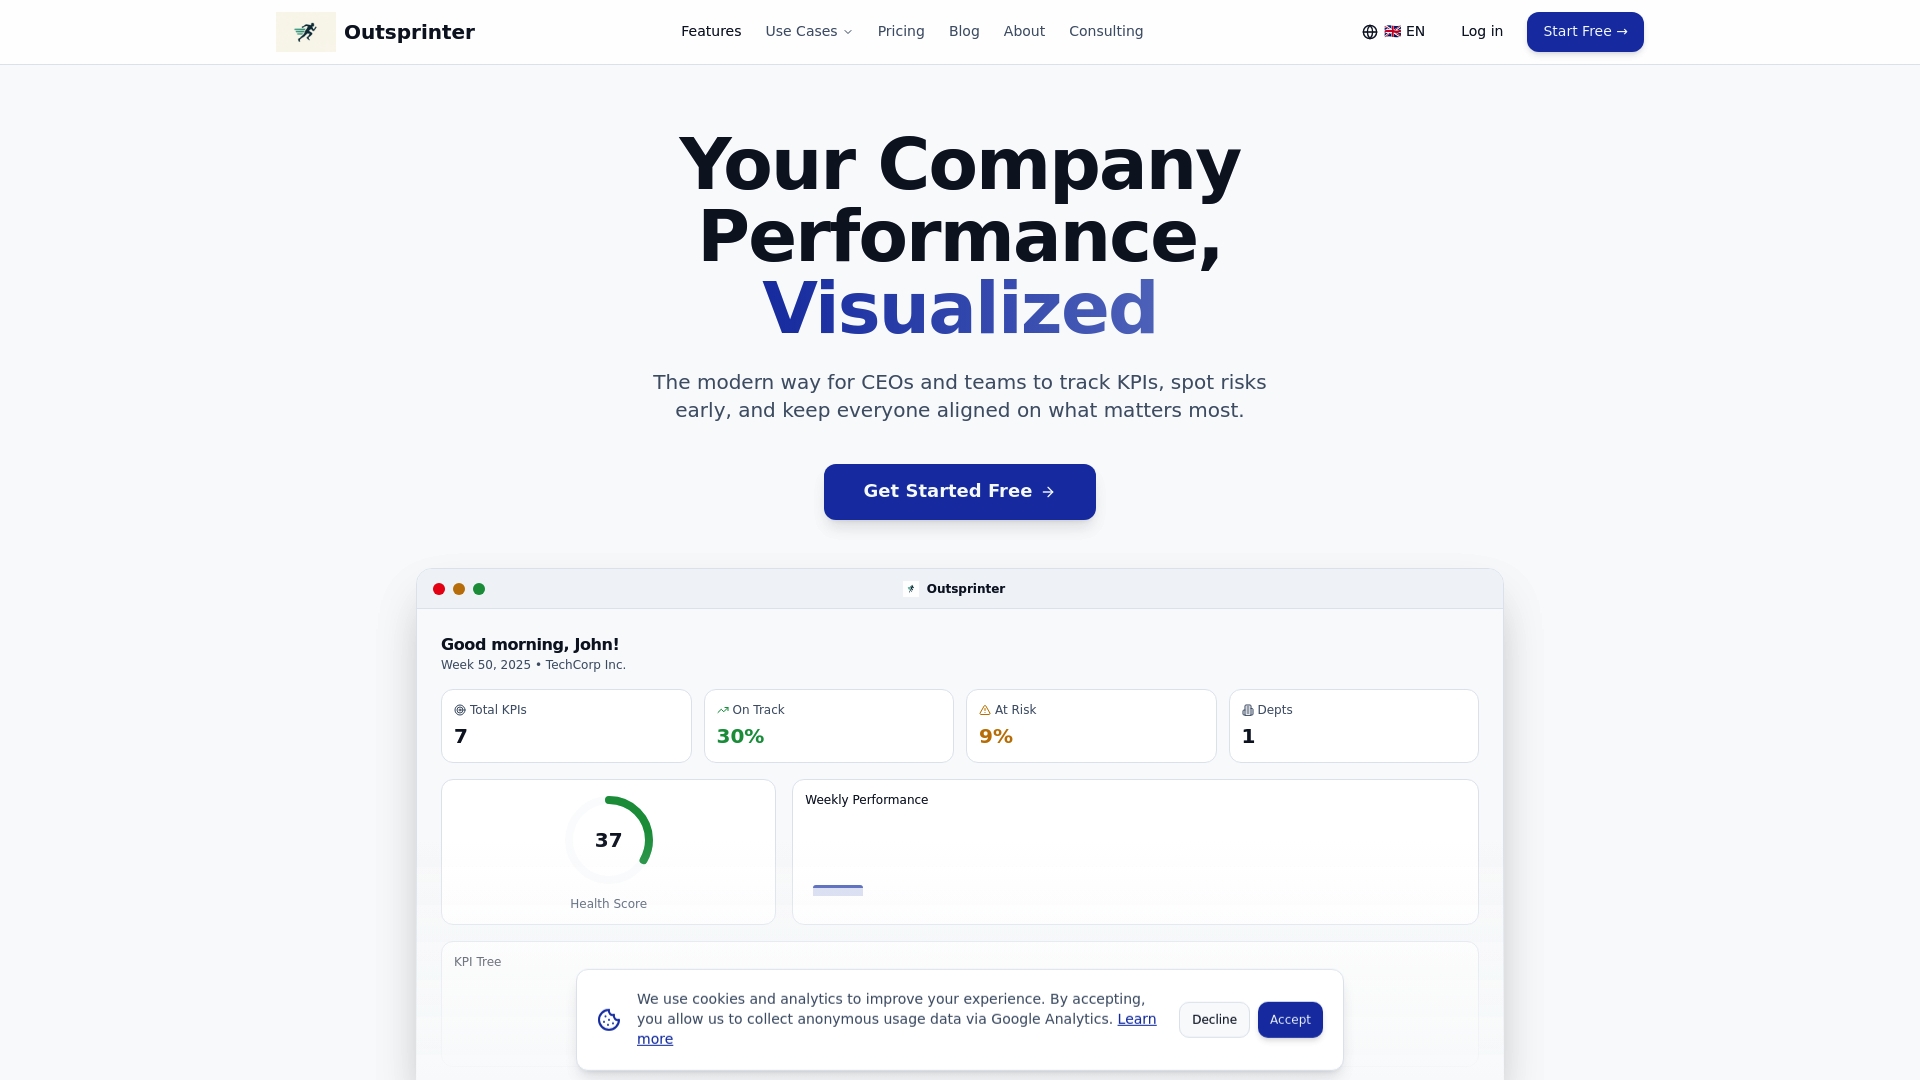
Outsprinter's KPI management software gives you a purpose-built environment to define, assign, track, and visualize every KPI type covered in this guide, from strategic to functional, from leading to outcome-based. Real-time dashboards update instantly as teams enter data, so you always have a current picture of performance without waiting for someone to compile a report. Pair that with advanced task management to connect each KPI directly to the work that drives it, and you close the gap between measurement and execution. Outsprinter also includes an AI assistant that helps you design better KPIs, analyze trends, and surface insights you might otherwise miss. If you are ready to move from tracking to genuinely managing performance, Outsprinter is built for exactly that.
Frequently asked questions
What are the main types of KPIs?
The main types include strategic, operational, leading, lagging, input, process, output, outcome, and functional KPIs. Common KPI types are categorized by time horizon, decision use, and where they sit in the organization.
What is the difference between leading and lagging indicators?
Leading indicators predict future outcomes, while lagging indicators show what has already happened. KPIs are often divided into these two categories to help teams both forecast and confirm performance.
Why is ownership and definition important for KPIs?
Clear ownership and precise definitions ensure consistency, prevent confusion, and enable actionable results. Effective KPI design emphasizes precise definitions, ownership, thresholds, and alignment to the decisions each metric must inform.
How can functional KPIs benefit individual departments?
Functional KPIs give departments like finance, sales, marketing, and HR a measurement language that reflects their actual work and responsibilities. Functional KPIs track progress in specific functions, helping teams stay focused on outcomes that matter to their mission.
Can a KPI be unactionable? What does it mean?
Yes, if a team cannot influence a metric, it becomes a reporting data point rather than a decision-making tool. A KPI can be actionable or unactionable depending entirely on how much control the responsible team has over the factors driving that metric.