
Many mid-sized B2B companies sit on mountains of data yet struggle to turn insights into strategic growth. The misconception that performance analytics requires massive IT investments or complex overhauls stops leaders from taking action. In reality, a phased approach delivers quick ROI while building the foundation for data-driven decision making that transforms organizational performance.
Table of Contents
- Understanding Performance Analytics: What It Is And Why It Matters
- Key Frameworks And Metrics For Effective Performance Analytics
- Avoiding Pitfalls And Integrating Performance Analytics Across Your Organization
- Real-World Impact: Case Studies And Measuring ROI From Performance Analytics
- Get Started With Outsprinter For Seamless Performance Analytics
- Frequently Asked Questions
Key takeaways
| Point | Details |
|---|---|
| Strategic KPI selection drives success | Companies measuring the right KPIs achieve significantly higher success rates by aligning metrics to corporate goals. |
| Integration boosts efficiency | Organizations that integrate data across departments avoid the 15% operational efficiency drop that siloed teams experience. |
| Structured frameworks reduce risk | Rigorous financial assessment reduces investment risk by 41% while accelerating break-even timelines by 8.3 months on average. |
| Phased implementation yields quick wins | Starting small with pilot teams generates measurable ROI within months without requiring full system transformation. |
Understanding performance analytics: what it is and why it matters
Performance analytics measures organizational progress through systematic KPI tracking and analysis. It transforms raw data into actionable insights that guide strategic decisions across departments. For CEOs and managers at mid-sized B2B companies, this means connecting daily operations to long-term corporate objectives through quantifiable metrics.
The reality is companies that measure the right KPIs consistently outperform competitors who track vanity metrics or irrelevant data points. Success hinges on strategic alignment, not data volume. Your finance team tracking cash flow metrics while marketing focuses on brand awareness creates valuable insights only when both tie back to revenue growth and customer acquisition goals.
Many leaders hesitate because they believe performance analytics requires expensive enterprise software and months of implementation. This common misconception about KPIs keeps organizations stuck in reactive mode. A phased approach starting with core metrics and expanding gradually proves far more effective than attempting a complete transformation overnight.
Foundational concepts include strategic KPI alignment, where every metric connects directly to business objectives, and data storytelling, which translates numbers into narrative insights that drive action. Consider these essential elements:
- Strategic KPI alignment ensures metrics reflect what actually matters to growth
- Data storytelling transforms spreadsheets into compelling narratives for stakeholders
- Cross-functional visibility breaks down departmental silos that hide critical patterns
- Iterative refinement allows your analytics approach to evolve with business needs
Dr. Jane Doe, organizational performance researcher, emphasizes that "data-driven decision making isn't about collecting more information. It's about asking better questions and measuring what genuinely impacts outcomes."
The key is starting with avoiding KPI overload by focusing on five to seven core metrics that directly influence your strategic priorities. This focused approach delivers clarity faster than tracking dozens of disconnected data points across your organization.
Key frameworks and metrics for effective performance analytics
The Balanced Scorecard approach provides a comprehensive framework by measuring progress across four critical dimensions. Financial metrics track revenue and profitability. Customer perspectives measure satisfaction and retention. Internal processes evaluate operational efficiency. Innovation and learning assess your organization's capacity for growth and adaptation.
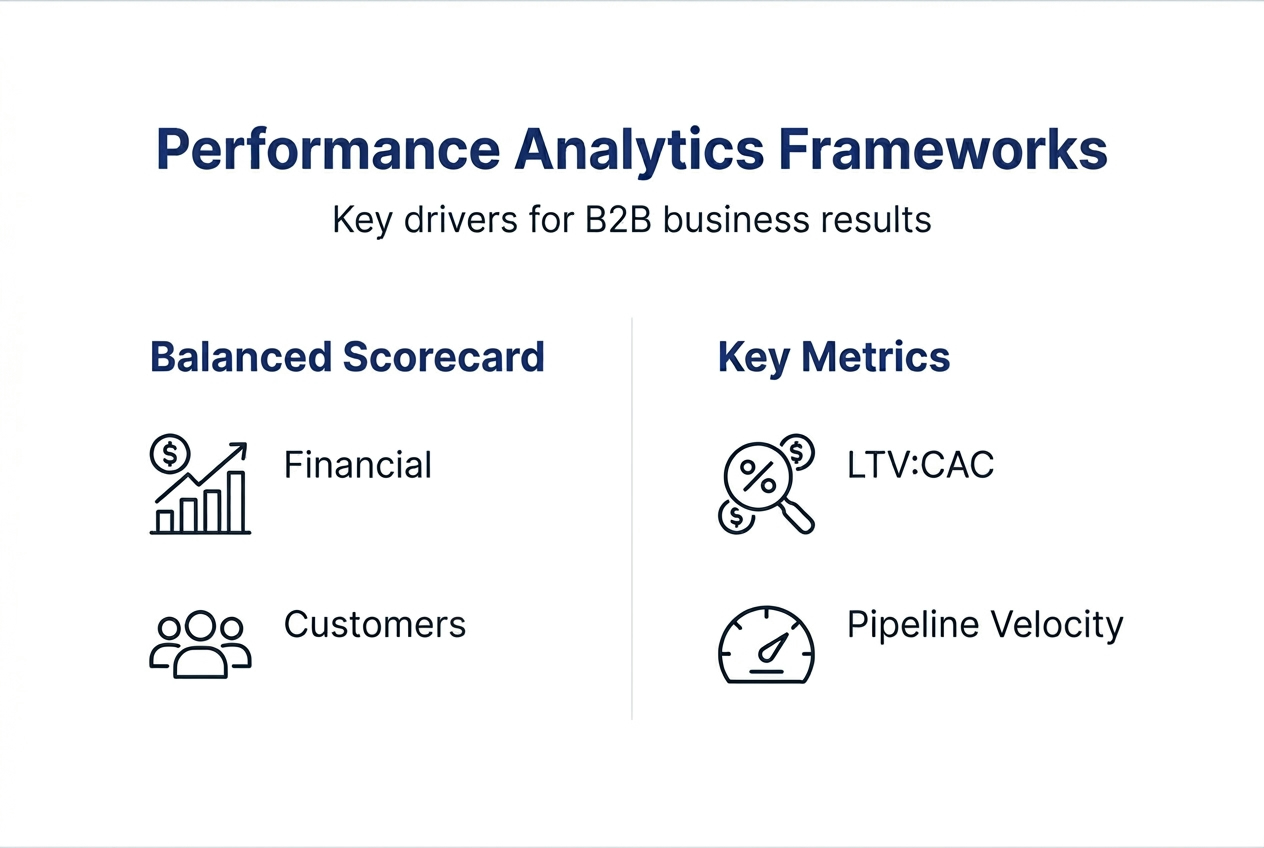
For B2B SaaS companies specifically, capital efficiency metrics separate sustainable growth from cash-burning expansion. Target an LTV:CAC ratio above 3:1 with payback periods under 12 months for capital-efficient growth in 2026. These benchmarks signal whether your customer acquisition strategy creates long-term value or drains resources faster than revenue can replace them.
Focus on metrics that predict future performance rather than just reporting past results:
- Net New ARR reveals actual revenue growth after accounting for churn and contraction
- Lead velocity rate forecasts pipeline health three to six months ahead of closed deals
- Net revenue retention shows whether existing customers expand their investment or quietly exit
- Customer acquisition cost trends indicate whether your go-to-market efficiency improves or deteriorates
These forward-looking indicators help you course-correct before problems become crises. The table below summarizes key metrics and their strategic impact for mid-sized B2B companies in 2026:
| Metric | 2026 Benchmark | Strategic Impact |
|---|---|---|
| LTV:CAC Ratio | 3:1 or higher | Ensures sustainable customer acquisition economics |
| CAC Payback Period | Under 12 months | Indicates capital efficiency and cash flow health |
| Net Revenue Retention | 110%+ | Signals product-market fit and expansion potential |
| Lead Velocity Rate | 10%+ monthly growth | Predicts future pipeline strength three months out |
Pro Tip: Connect every KPI to a specific corporate objective before adding it to your dashboard. If you can't articulate how a metric influences strategic decisions, it's probably a vanity metric that wastes attention. Review boosting KPI results for guidance on aligning metrics to goals that actually move your business forward.
The distinction between lagging indicators like revenue and leading indicators like pipeline velocity matters enormously. Lagging metrics tell you what happened. Leading metrics show where you're heading, giving you time to adjust course before quarterly results disappoint stakeholders.
Avoiding pitfalls and integrating performance analytics across your organization
Three common mistakes sabotage performance analytics initiatives before they generate value. First, tracking irrelevant KPIs that look impressive but don't influence strategic decisions wastes resources and confuses priorities. Second, siloed data across departments creates blind spots where critical patterns hide. Third, lacking a data-driven culture means insights gather dust instead of driving action.

Organizations that fail to integrate data experience real consequences. Companies with fragmented data systems see a 15% decrease in operational efficiency compared to those with integrated analytics. When your sales team can't access marketing attribution data or finance operates with different customer lifetime value calculations than customer success, decision quality suffers across the board.
Structured evaluation frameworks prove equally critical. Companies without rigorous assessment face 3.2x higher rates of project failure and capital misallocation compared to organizations that systematically evaluate initiatives before and during execution. The cost of poor project selection compounds over time as resources flow toward low-impact activities.
Implement these best practices to prevent common pitfalls:
- Establish cross-functional KPI ownership so departments collaborate instead of competing
- Create single source of truth data repositories that eliminate conflicting reports
- Build regular review cadences where teams discuss metrics and adjust strategies
- Train managers to interpret data and ask probing questions rather than accepting numbers at face value
- Automate data collection wherever possible to reduce manual errors and save time
Pro Tip: Start cross-functional collaboration with a pilot project involving two departments before rolling out enterprise-wide. This builds trust, surfaces integration challenges early, and creates internal champions who evangelize data-driven decision making to skeptical colleagues.
Guard against vanity metrics that make you feel good without predicting outcomes. Social media followers, website traffic, and email open rates often fall into this category unless they clearly connect to revenue or customer acquisition. Similarly, last-click attribution bias credits the final touchpoint before conversion while ignoring the earlier interactions that built awareness and interest.
Building a data-driven culture requires more than dashboards and KPI reviews. It demands psychological safety where teams can acknowledge negative trends without fear, intellectual curiosity that questions assumptions, and accountability systems that reward data-informed risk taking. Review the performance alignment guide for frameworks that foster these cultural attributes across mid-sized B2B organizations.
Real-world impact: case studies and measuring ROI from performance analytics
The transformation from gut-feel decisions to data-driven strategy generates measurable results. Real-world case studies demonstrate 650% ROI and 10x cost-per-lead reduction when B2B companies implement structured performance analytics. These aren't outlier results from Fortune 500 enterprises with unlimited budgets. They come from mid-sized companies that started small and scaled systematically.
The comparison below shows typical before and after metrics from organizations that adopted comprehensive performance analytics:
| Metric | Before Analytics | After Analytics | Improvement |
|---|---|---|---|
| Marketing ROI | 180% | 650% | 261% increase |
| Cost Per Lead | $120 | $12 | 90% reduction |
| Sales Forecast Accuracy | 42% | 89% | 112% improvement |
| Project Success Rate | 58% | 87% | 50% increase |
Financial impact extends beyond marketing efficiency. Companies employing rigorous assessment reduce investment risk by 41% while accelerating break-even timelines by 8.3 months on average. This matters enormously for mid-sized companies where capital allocation decisions determine competitive positioning and growth trajectories.
Performance analytics improves forecasting accuracy by 58%, transforming budgeting from guesswork into strategic planning. When finance teams can predict cash flow with confidence and sales leaders forecast pipeline conversion reliably, your organization makes better hiring decisions, negotiates supplier contracts from strength, and times market expansion moves precisely.
Key benefits that case studies consistently demonstrate include:
- Improved marketing ROI through better channel attribution and budget allocation
- Reduced customer acquisition costs by identifying and scaling high-performing strategies
- Enhanced forecasting precision that enables proactive rather than reactive management
- Faster break-even timelines by eliminating low-ROI initiatives early
- Decreased project failure rates through data-backed prioritization frameworks
Salesforce's VP of Analytics notes that "performance analytics isn't just a tool or a dashboard. It's a mindset that permeates how organizations evaluate opportunities, allocate resources, and measure success. Companies that embrace this mindset consistently outperform competitors who rely on intuition alone."
The financial impact data from the Research and Metric analysis reveals that structured frameworks identify underperforming initiatives 5.7 months earlier than informal review processes. This early warning system prevents continued investment in failing projects and redirects resources toward higher-potential opportunities before competitors seize market advantages.
For practical guidance on calculating your specific ROI, explore KPI tracking ROI calculation to understand how tracking software investments pay for themselves through improved decision quality and resource allocation.
Get started with Outsprinter for seamless performance analytics
You've seen how performance analytics transforms strategic decision making and drives measurable growth. The challenge is moving from concept to implementation without derailing current operations or requiring massive upfront investment.
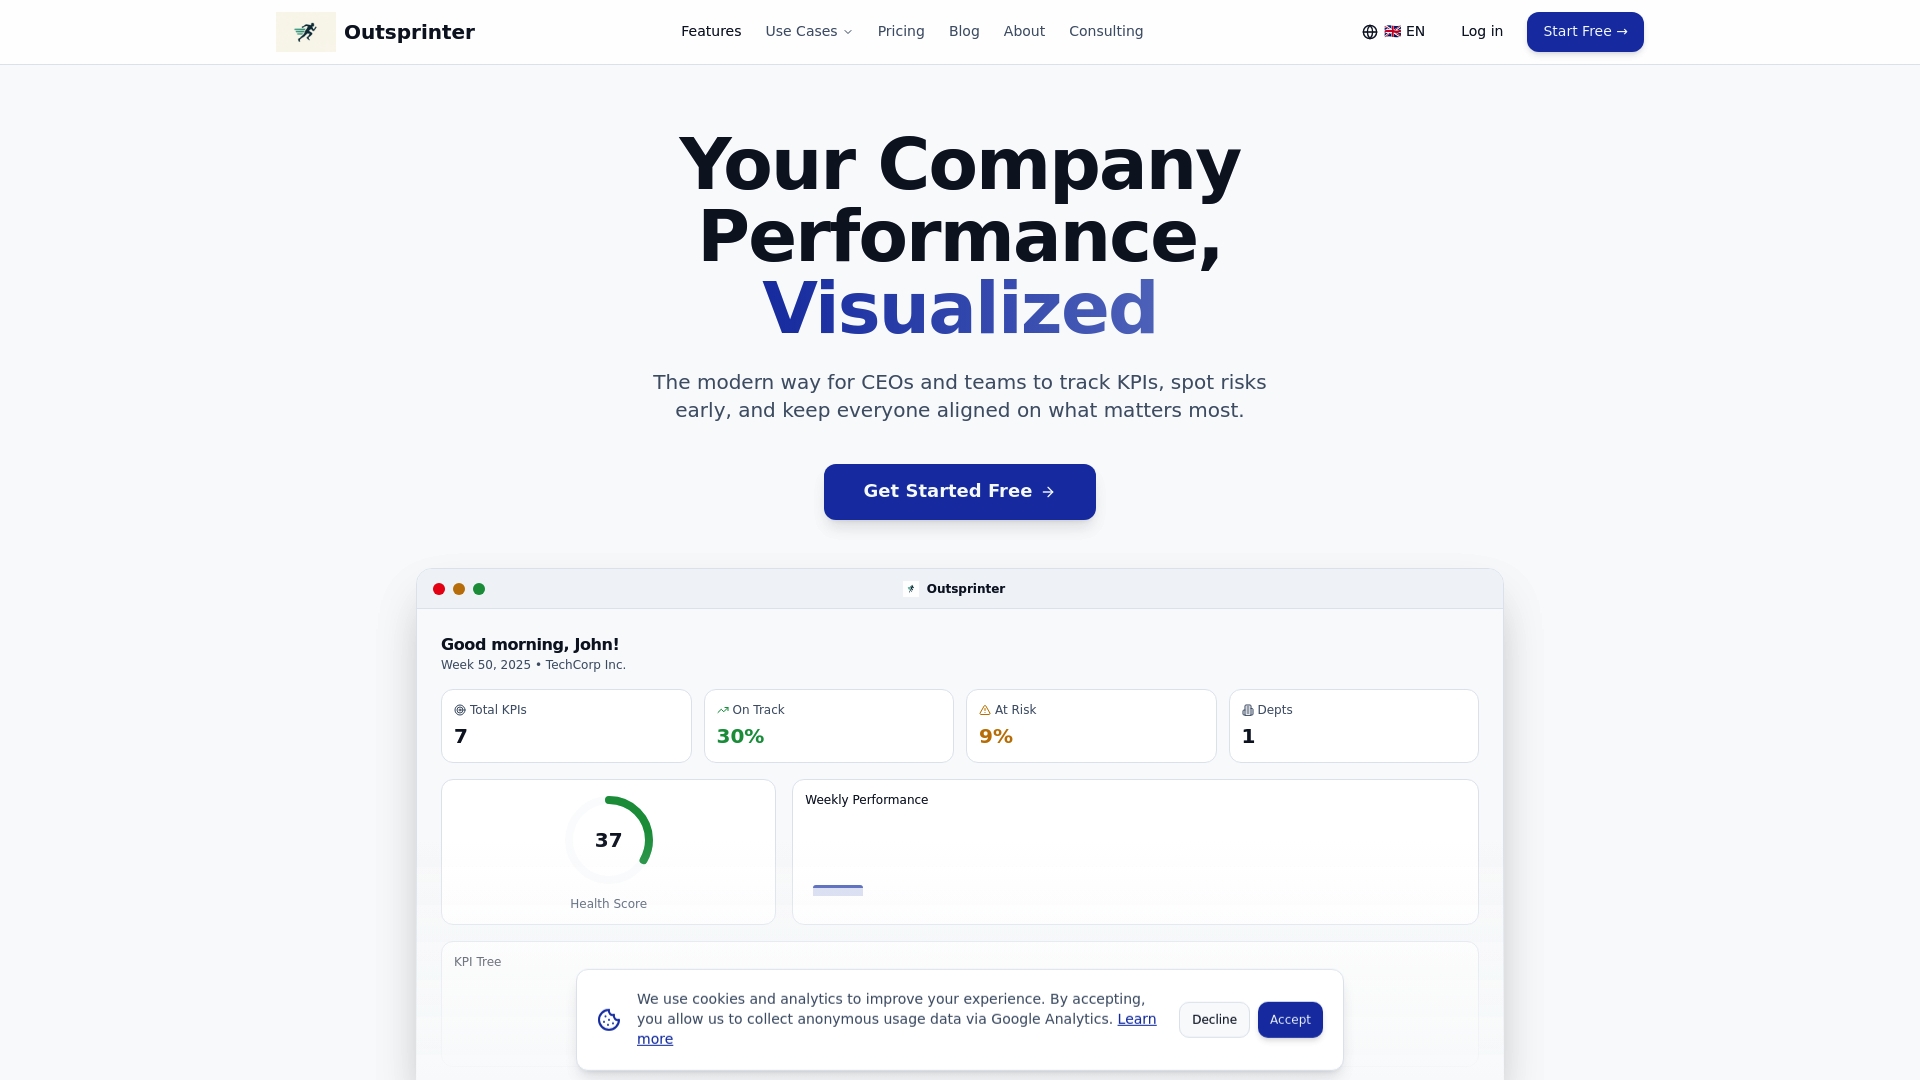
Outsprinter provides a practical entry point for mid-sized B2B companies ready to harness performance analytics. The platform combines real-time KPI dashboards, sprint planning tools, and AI-powered insights in a single interface designed for leadership teams who need visibility without complexity. Role-based access ensures CEOs see strategic overviews while department managers dive into operational details that drive daily decisions.
The integration capabilities break down data silos that sabotage cross-functional collaboration. Your sales metrics, marketing attribution data, and financial forecasts live in one system where patterns emerge naturally. This integrated approach delivers the operational efficiency gains and forecasting accuracy improvements discussed throughout this guide.
Pro Tip: Start with a pilot team focused on one strategic objective. Track five core KPIs for 30 days using Outsprinter's sprint framework. This generates quick wins that build organizational confidence while identifying integration needs before full rollout.
Explore the Outsprinter platform to see how mid-sized B2B companies implement performance analytics without disrupting current operations. The organizational performance guide offers additional frameworks for translating strategic goals into measurable weekly actions that compound into transformational results over time.
Frequently asked questions
What are the first KPIs to focus on for mid-sized B2B companies?
Start with revenue growth rate, customer acquisition cost, customer lifetime value, cash flow, and net revenue retention. These five metrics provide comprehensive visibility into financial health, customer economics, and growth sustainability. Add department-specific KPIs only after establishing these foundational metrics across your leadership team.
How can performance analytics improve cross-department collaboration?
Shared dashboards create a common language where marketing, sales, and customer success align around unified objectives rather than optimizing for conflicting departmental goals. When everyone sees how their metrics influence company-wide outcomes, collaboration becomes natural rather than forced. This visibility eliminates the blame games that plague siloed organizations.
What is a phased approach to implementing performance analytics?
Phase one establishes core financial and customer metrics with manual or simple tracking for 30 days. Phase two adds department-specific KPIs and implements basic automation to reduce manual data entry. Phase three integrates cross-functional data and introduces predictive analytics. This gradual approach generates ROI at each stage while building organizational capability and cultural acceptance.
How do I avoid KPIs that don't drive value?
Apply the "so what" test to every proposed metric. If you can't articulate what action you'd take when the KPI moves up or down, it's probably a vanity metric. Focus on leading indicators that predict future outcomes rather than lagging metrics that merely report past results. Review metrics quarterly and ruthlessly eliminate those that don't influence strategic decisions.
What ROI can I realistically expect from performance analytics?
Mid-sized B2B companies typically see 180% to 350% ROI within the first year through improved resource allocation, reduced waste on underperforming initiatives, and faster identification of high-value opportunities. Marketing cost-per-lead often drops 40% to 60% as attribution clarity improves. Project success rates increase 30% to 50% through data-backed prioritization frameworks. Results vary based on current analytics maturity and implementation quality.
Recommended
- Performance alignment in 2026: A guide for B2B leaders
- Outsprinter - Team Performance & Sprint Management Platform
- Marketing KPI Tracking and Sprint Execution System | Outsprinter
- Organizational performance guide: boost KPI results | Outsprinter
- Leverage LinkedIn industry experts to boost B2B marketing - Kawaak
- Marketing de Performance: +35% Vendas em 6 Meses para PMEs