
TL;DR:
- Actionable performance data requires specificity, context, ownership, predefined actions, and timeliness.
- Focusing on fewer, well-chosen KPIs improves response effectiveness and organizational performance.
- Responding quickly to real-time data signals can lead to significant efficiency gains and cost savings.
Most organizations collect more data than they will ever use. Teams generate reports, dashboards fill with charts, and yet decisions still feel slow or reactive. The real breakthrough comes not from gathering more data but from acting on the right data at the right moment. Fleet case studies show 18 to 31% fuel efficiency gains and millions in annual savings simply by responding to real-time idle time, speed, and route data. That kind of result is not a technology miracle. It is what happens when performance data becomes genuinely actionable. This guide breaks down exactly what that means and how you can replicate it in your organization.
Table of Contents
- Defining actionable performance data: What it is (and isn't)
- Key components of actionable performance data
- Real-world examples: How actionable performance data drives outcomes
- Implementing actionable performance data: Best practices and pitfalls
- Our perspective: Why focusing on fewer, actionable metrics beats big data every time
- How Outsprinter helps you harness actionable performance data
- Frequently asked questions
Key Takeaways
| Point | Details |
|---|---|
| Actionable data defined | It is performance data with context, ownership, and a clear course of action. |
| Fewer metrics, more results | Limiting tracked KPIs to 8-15 focuses the team and increases effectiveness. |
| Measurable business impact | Applying actionable data can yield double-digit improvements and significant cost savings. |
| Ownership and response | Every actionable metric must have a defined owner and rapid response plan in place. |
Defining actionable performance data: What it is (and isn't)
Performance data is everywhere. Sales figures, project completion rates, customer satisfaction scores, uptime percentages. Most leaders have access to all of it. Very little of it actually changes behavior. That gap between data and decision is exactly where the concept of actionable performance data lives.
Actionable performance data is information that is specific enough, timely enough, and contextualized enough to prompt a clear, immediate response from the right person. It is not just a number on a screen. It is a number with meaning, ownership, and a defined path forward.
Here is what separates actionable data from the kind that collects digital dust:
- Specificity: It points to a precise area, team, process, or outcome rather than a broad trend.
- Context: It includes thresholds that define what is normal, what is a warning, and what is a crisis.
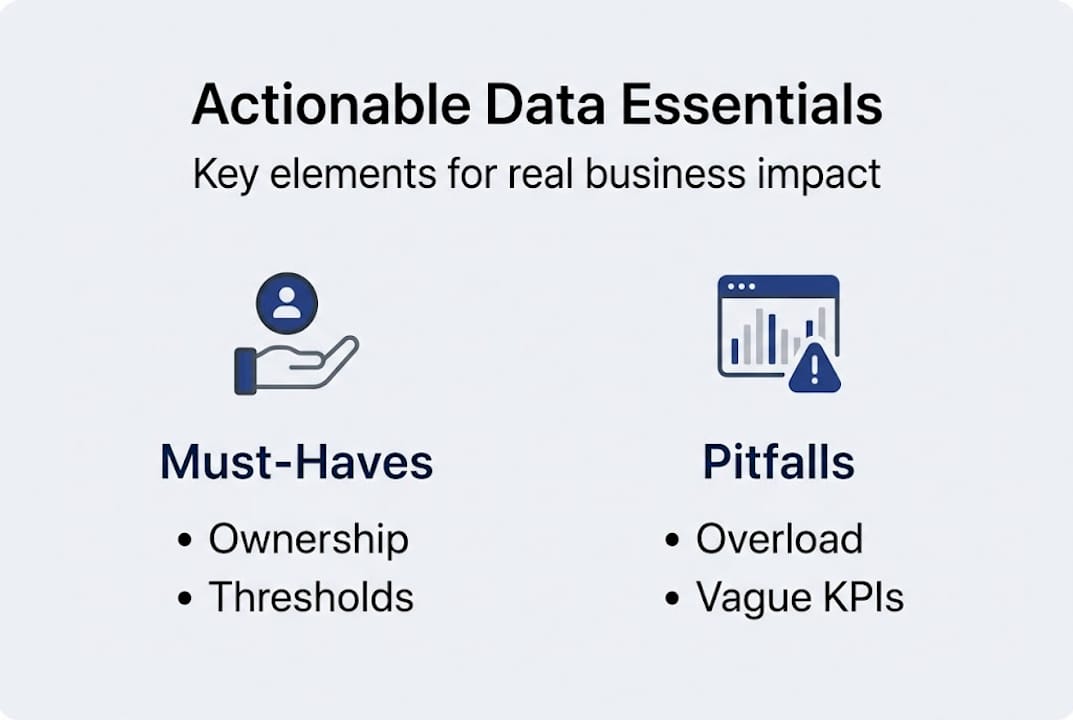
- Ownership: Someone is explicitly responsible for responding when the metric crosses a threshold.
- Predefined action: The team already knows what to do when a red flag appears, without needing a meeting to figure it out.
- Timeliness: The data reaches the right person before the window to act has closed.
As project management best practices make clear, not all data is actionable. It requires context, thresholds, and predefined actions to create real change.
Think about a generic KPI like "customer satisfaction score." If it drops 3 points in a quarter, most teams shrug. But if that same metric is tied to a specific product team, has a threshold of 4.2 stars, and triggers a review call whenever it falls below that level, it becomes actionable. The number itself did not change. The system around it did.
The difference between a useful metric and a useless one is rarely the data itself. It is the structure you build around it.
This is also why most KPIs fail to drive change. They get created, reviewed monthly in a slide deck, and then forgotten until the next quarterly business review. Actionable performance data demands a fundamentally different approach.
Key components of actionable performance data
Once you understand what actionable data is, the next step is building the infrastructure to support it. There are five non-negotiable components every business leader and project manager should put in place.
- Metric ownership: Every KPI must have a named individual or team responsible for monitoring it and responding when it moves outside its normal range.
- Defined thresholds: Set green, yellow, and red zones for each metric. Without these, every number looks equally important or equally irrelevant.
- Leading and lagging indicators: Use lagging indicators (like revenue) to confirm results and leading indicators (like pipeline coverage) to anticipate them. A healthy system needs both.
- Real-time or near-real-time tracking: Weekly reports are often too slow. Decisions made on stale data are guesses dressed up as strategy.
- A limited set of KPIs: An outcome-based KPI framework recommends tracking between 8 and 15 KPIs to prevent metric sprawl and keep attention focused where it matters.
| Component | Why it matters | Common mistake |
|---|---|---|
| Metric ownership | Drives accountability | Shared ownership means no ownership |
| Clear thresholds | Enables fast, confident action | Thresholds set once and never reviewed |
| Leading indicators | Allows proactive management | Tracking only lagging results |
| Real-time tracking | Reduces response lag | Monthly reporting cycles |
| Limited KPIs | Protects team focus | Tracking every available metric |
Knowing how many KPIs to have is a critical design decision. More is not better. In fact, research consistently shows that organizations tracking fewer, well-chosen metrics outperform those tracking dozens. Understanding avoiding KPI overload should be part of every performance review conversation.
Pro Tip: Before adding a new KPI to your dashboard, ask: "If this metric moved tomorrow, would we know exactly what to do?" If the answer is no, the metric is not ready to track.
Real-world examples: How actionable performance data drives outcomes
Theory is useful. Numbers are better. Here is what happens when organizations stop collecting data and start acting on it.
Enterprise fleet management is one of the clearest examples. Fleet operators responding to real-time data on idle time, speed, and route efficiency achieved fuel savings of 18 to 31% and between $427,000 and $4.8 million in annual cost reductions. These were not achieved through technology upgrades alone. They came from building response protocols around the data, meaning drivers and managers knew exactly what action to take when idle time exceeded a set threshold.
18 to 31% fuel savings. Up to $4.8M annually. The same data, used differently.
The same principle applies across industries:
- Sales teams that monitor pipeline coverage ratios and deal velocity in real time consistently outperform teams that review forecast data in weekly meetings.
- IT project managers using sprint velocity and defect rate metrics to trigger daily standups when variance exceeds 10% ship higher quality products with fewer delays.
- Customer service operations that track first-call resolution in real time and route complex cases immediately report measurably higher customer retention.
| Sector | Actionable metric | Outcome |
|---|---|---|
| Fleet / logistics | Idle time, route efficiency | 18 to 31% fuel reduction |
| Sales | Pipeline coverage, deal velocity | Improved forecast accuracy |
| IT projects | Sprint velocity, defect rate | Faster delivery, fewer bugs |
| Customer service | First-call resolution rate | Higher customer retention |
The pattern is consistent. Organizations that boost KPI results are not tracking more data. They are responding faster to less data, the right data.

Implementing actionable performance data: Best practices and pitfalls
Knowing the theory and seeing the results are not enough. You need a clear process to build an actionable data system that actually works inside your organization.
A five-step implementation approach:
- Define: Choose your 8 to 15 most important metrics and write a one-sentence explanation of why each one matters to a specific business outcome.
- Assign: Give each metric a single named owner. This person is accountable for monitoring, escalating, and responding.
- Track: Move to real-time or daily visibility using a live dashboard rather than static reports. Set KPI thresholds so the system flags issues automatically.
- Respond: Document a response protocol for each red-zone alert. Who acts? What actions are permitted? Within what timeframe?
- Review: Reassess your metrics quarterly. Business priorities shift. Thresholds that were correct six months ago may now be too loose or too tight.
Common pitfalls to avoid:
- Too many metrics: The outcome-based KPI framework is clear that metric sprawl reduces focus and effectiveness. If you are tracking more than 15 KPIs, you are tracking noise.
- Unclear ownership: A metric with multiple owners is a metric with no owner. Shared accountability consistently leads to delayed responses.
- Static thresholds: Thresholds set at launch and never revisited become irrelevant as the business evolves. Quarterly reviews are not optional.
- No response protocol: Flagging a problem is only useful if the team knows what to do next. Build the protocol before you need it.
Pro Tip: Use data transparency for teams as a design principle. When every team member can see the same real-time metrics, accountability becomes cultural rather than managerial.
It also helps to avoid KPI overload from the start rather than trying to reduce it after the fact. Starting lean and adding metrics deliberately is far easier than cutting after stakeholders have become attached to their favorite charts.
Our perspective: Why focusing on fewer, actionable metrics beats big data every time
Here is something most strategy consultants will not tell you: the organizations that struggle most with performance data are often the ones that invested the most in collecting it. More dashboards, more data pipelines, more reporting tools. And yet, the needle does not move.
The uncomfortable truth is that data volume creates the illusion of control. Executives feel informed because they have access to hundreds of metrics. But feeling informed and being able to act are very different things.
The outcome-based KPI framework confirms that metric sprawl is one of the most common and most damaging performance management failures, and that limiting tracked metrics to 8 to 15 is consistently more effective.
In our experience, a team of five people aligned around three truly actionable KPIs will outperform a team of fifty drowning in a 40-metric dashboard every single time. The discipline to say "we will only track what we are prepared to act on" is harder than it sounds. It requires saying no to interesting data. But that discipline is exactly what separates organizations that perform from those that just report.
If you want to build KPIs that actually drive results, start by cutting your current list in half. You will likely find that nothing important gets missed, and that your team finally has the clarity to act.
How Outsprinter helps you harness actionable performance data
Reading about actionable performance data is the first step. Operationalizing it is where most teams get stuck, usually because their tools were built for reporting rather than action.
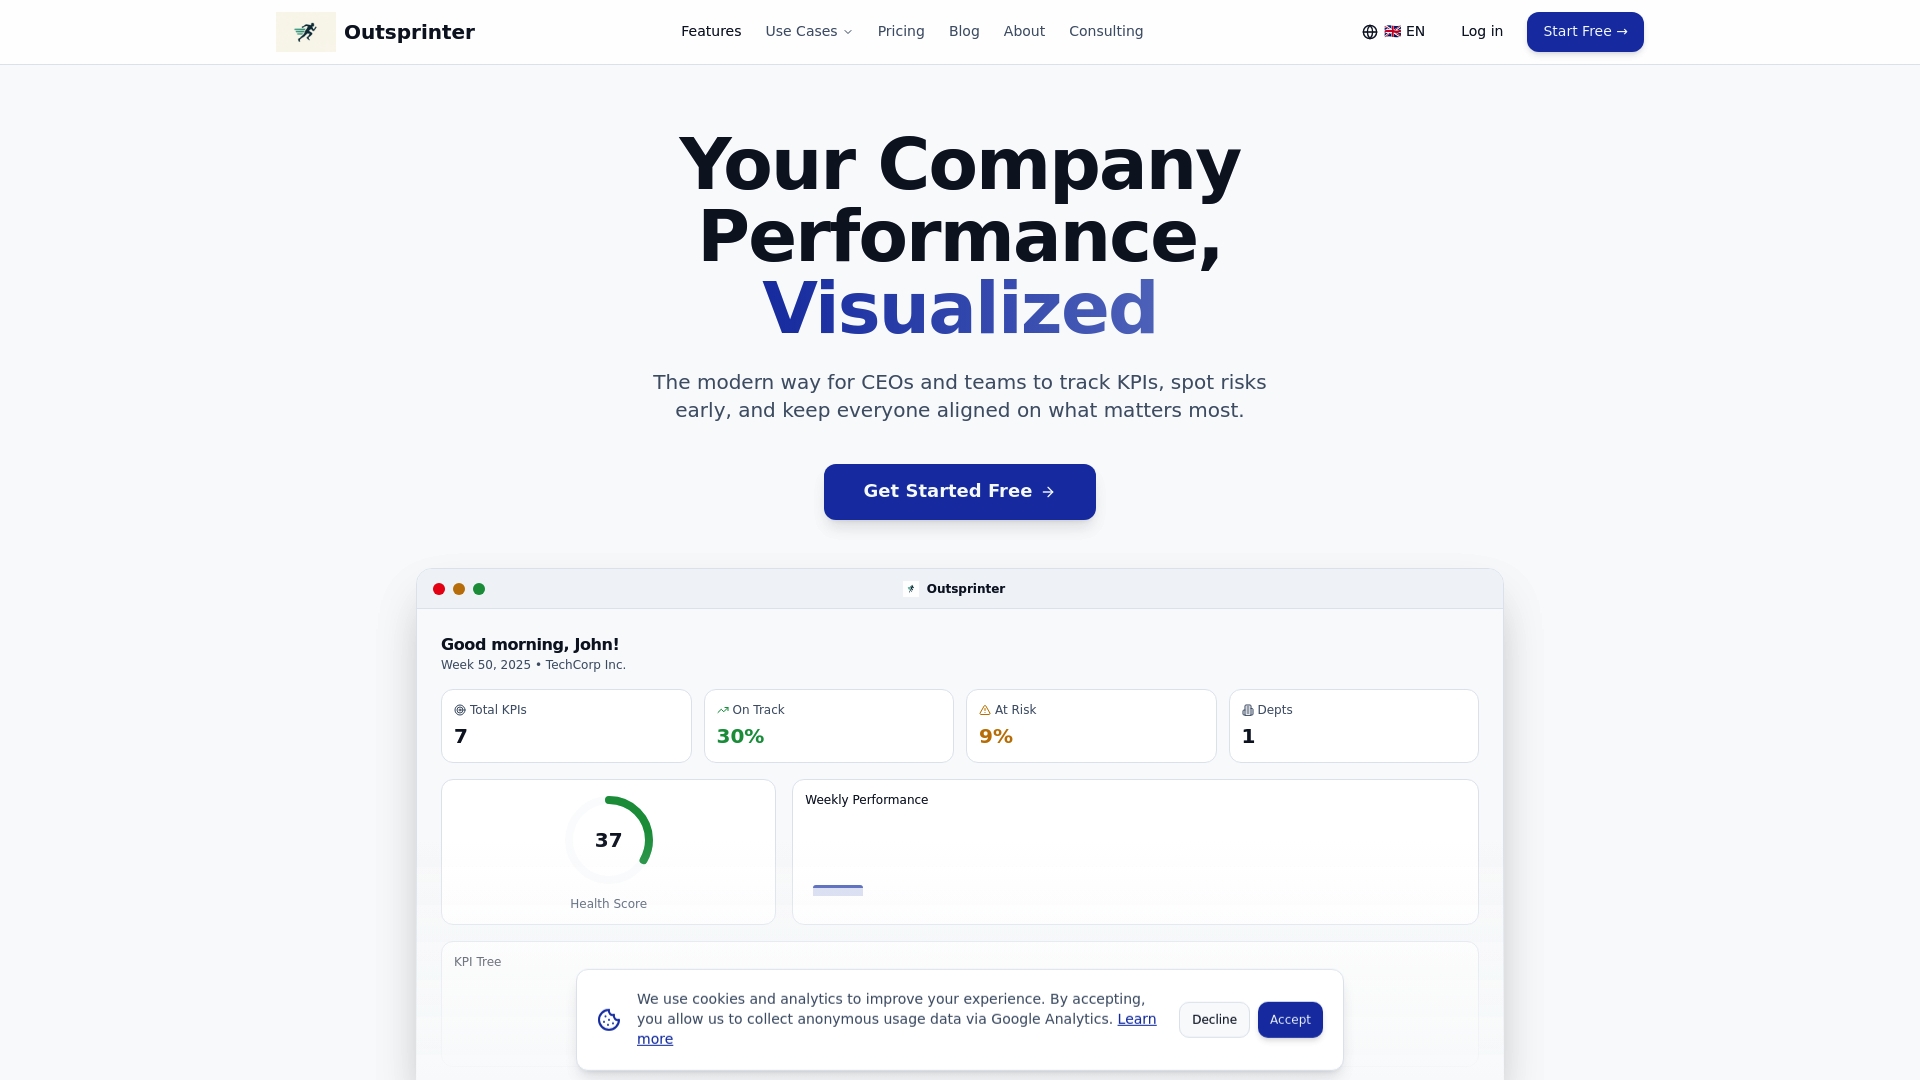
Outsprinter is built specifically for business leaders and project managers who need to move from insight to decision without friction. With real-time KPI tracking, you can define thresholds, assign metric owners, and receive instant alerts when performance shifts. The KPI tracking and task management tools let you connect performance data directly to project workflows, so a red-zone alert does not just notify you. It drives a next action. Onboarding takes minutes, and the system is designed to grow with your team as your metrics evolve.
Frequently asked questions
What is actionable performance data?
Actionable performance data gives you clear, timely, and context-driven insights tied to defined thresholds and owners so your team can make informed decisions and take tangible action without delay.
How many KPIs should my company track?
Experts recommend tracking between 8 and 15 KPIs to avoid metric overload and ensure every metric you monitor has a clear owner and a defined response protocol.
What is the difference between actionable and non-actionable data?
Actionable data has thresholds, ownership, and a predefined response. Non-actionable data, as project management research confirms, often leads to analysis paralysis or simply gets ignored.
How can I turn performance data into action?
Assign a named owner to each metric, set green and red thresholds, build a simple live dashboard, and document a response protocol so your team knows exactly what to do when a metric triggers an alert.
Can actionable performance data really improve my bottom line?
Yes. Organizations applying actionable data principles have reported 18 to 31% efficiency gains and up to $4.8 million in annual savings by responding consistently to the right performance signals.