
Selecting the right performance metrics can feel overwhelming when you're trying to improve team productivity and project outcomes. Many managers struggle to identify which indicators truly matter and which ones just create noise. This article cuts through the confusion by presenting practical examples of performance metrics that deliver real insights. You'll learn how to evaluate these metrics, compare options for different team goals, and implement them effectively to boost efficiency and drive measurable results.
Table of Contents
- Key takeaways
- How to evaluate and select effective performance metrics
- Top examples of performance metrics for teams and projects
- Comparing performance metrics for different team goals
- Implementing performance metrics for ongoing management and improvement
- Streamline your performance management with Outsprinter
- Frequently asked questions
Key Takeaways
| Point | Details |
|---|---|
| Align metrics to goals | Select metrics that directly reflect strategic objectives and guide actions that move the team toward measurable outcomes. |
| Apply SMART framework | Apply the SMART framework by ensuring metrics are specific, measurable, achievable, relevant, and time bound. |
| Balance dimensions | Use a balanced set of efficiency, quality, cost, and engagement metrics to capture a complete view. |
| Avoid vanity metrics | Focus on metrics that drive decisions and actions rather than numbers that look impressive but have little impact. |
| Review regularly | Schedule quarterly reviews to keep measures aligned with evolving goals and priorities. |
How to evaluate and select effective performance metrics
Choosing relevant performance metrics starts with aligning them to specific organizational goals and measurable outcomes. Without this alignment, you risk tracking numbers that look impressive but don't influence decisions or behaviors. Every metric you select should answer a critical business question and guide actions that move your team closer to strategic objectives.
The SMART framework provides a solid foundation for metric selection. Your metrics should be specific enough to avoid ambiguity, measurable with available data, achievable within your team's capacity, relevant to current priorities, and time-bound with clear evaluation periods. This structure prevents the common trap of choosing metrics that sound important but prove impossible to track or act upon.
Consider multiple performance dimensions when building your measurement system. Efficiency metrics reveal how quickly work gets done. Quality indicators show how well teams execute. Cost metrics track resource utilization. Engagement measures assess team sustainability and morale. A balanced approach across these dimensions gives you a complete picture rather than a narrow view that might miss critical issues.
Pro Tip: Avoid vanity metrics that make dashboards look busy but don't drive action. Focus on metrics that directly influence decisions and behaviors.
Watch out for vanity metrics that inflate numbers without providing actionable intelligence. Metrics like total hours worked or number of meetings attended rarely correlate with meaningful outcomes. Instead, focus on indicators that reveal bottlenecks, quality issues, or opportunities for improvement. The best metrics make it obvious what action to take next.
Regularly review and adjust your metrics as projects evolve and priorities shift. What matters in a product launch phase differs from what matters during maintenance. Schedule quarterly metric reviews to ensure your measurement system stays aligned with current goals. This flexibility prevents you from optimizing for outdated objectives while missing emerging opportunities.
Top examples of performance metrics for teams and projects
Effective key performance indicators include cycle time, task completion rate, and quality measures such as defect density. These metrics provide concrete data points that reveal how efficiently your team operates and where improvements can deliver the biggest impact. Let's explore each category with practical examples you can implement immediately.
Cycle time measures the duration from when work starts until completion. This metric reveals process efficiency and helps identify delays in your workflow. For software teams, cycle time might track days from code commit to production deployment. For marketing teams, it could measure time from campaign brief to launch. Shorter cycle times generally indicate smoother processes and fewer bottlenecks.
Task completion rate reflects the percentage of planned work finished within a given timeframe. This straightforward metric shows productivity trends and helps forecast capacity. Calculate it by dividing completed tasks by total planned tasks, then multiply by 100. A consistently high completion rate suggests realistic planning and strong execution, while declining rates signal capacity issues or scope creep.
| Metric type | What it measures | Best for |
|---|---|---|
| Cycle time | Speed of work completion | Identifying process bottlenecks |
| Task completion rate | Productivity and reliability | Capacity planning and forecasting |
| Defect density | Quality of outputs | Maintaining standards and reducing rework |
| Employee engagement score | Team morale and sustainability | Predicting retention and performance |
| Cost performance index | Budget efficiency | Financial control and resource optimization |
Quality metrics like defect density track flaws in outputs relative to size or volume. For software, this might be bugs per thousand lines of code. For content teams, it could be error rate per article. Manufacturing teams track defects per production batch. Lower defect density indicates higher quality standards and less rework, which directly impacts efficiency and customer satisfaction.
Employee engagement scores measure team morale, commitment, and satisfaction through surveys or pulse checks. Engaged teams consistently outperform disengaged ones across every metric. Track engagement quarterly using standardized questions about autonomy, purpose, growth opportunities, and team dynamics. Rising engagement scores predict better retention and higher productivity.

Cost performance index reveals budget efficiency by comparing earned value to actual costs. A CPI above 1.0 means you're getting more value than you're spending. Below 1.0 signals budget overruns. This metric helps project managers spot financial trouble early and adjust resource allocation before small issues become major problems.
Comparing performance metrics for different team goals
Different metrics serve distinct purposes depending on specific performance goals and team functions. Understanding these distinctions helps you build a measurement system that matches your actual priorities rather than tracking generic indicators that don't drive meaningful change.
Productivity metrics suit execution-focused teams where speed and volume matter most. Sales teams track deals closed per rep. Customer service teams measure tickets resolved per hour. Development teams count story points completed per sprint. These metrics shine when your primary goal is maximizing output within quality standards. They help identify high performers, optimize workflows, and set realistic capacity expectations.
Quality metrics fit teams where output standards trump speed. Design teams track client approval rates and revision rounds. Legal teams measure contract accuracy and compliance scores. Medical teams monitor error rates and patient outcomes. When mistakes carry high costs or reputational risks, quality metrics take priority over productivity indicators. They ensure excellence doesn't get sacrificed for speed.
| Team focus | Primary metric type | Example metrics | When to use |
|---|---|---|---|
| Execution speed | Productivity | Tasks completed, cycle time, throughput | High-volume, repeatable work |
| Output standards | Quality | Defect rate, accuracy score, client satisfaction | High-stakes, specialized work |
| Team sustainability | Engagement | Retention rate, satisfaction score, burnout indicators | Long-term projects, competitive talent markets |
| Mixed objectives | Balanced dashboard | Combination of efficiency, quality, and engagement | Complex projects requiring multiple dimensions |
Engagement metrics align with teams focusing on sustainability and long-term performance. Startups building culture track employee net promoter scores. Agencies competing for talent monitor retention rates and satisfaction surveys. Research teams measure collaboration quality and knowledge sharing. These metrics predict future performance by revealing whether your team can maintain current output levels without burning out.
Pro Tip: Use mixed-metric dashboards to cover multiple angles and avoid optimizing one dimension at the expense of others.
Mixed-metric dashboards work best for complex projects requiring balance across dimensions. Product teams need speed to market, quality standards, and engaged engineers. Marketing teams need campaign volume, conversion quality, and creative sustainability. Build dashboards that show relationships between metrics so you can spot tradeoffs early. For example, rising productivity with falling quality signals unsustainable pace.
Customization based on project type and industry is essential for meaningful measurement. A construction project manager needs safety incidents, schedule variance, and budget performance. A software project manager needs velocity, bug escape rate, and technical debt. Generic metrics miss the nuances that make each industry and project type unique. Invest time upfront to identify metrics that truly reflect success in your specific context.
Implementing performance metrics for ongoing management and improvement
Regular KPI tracking and management platforms turn raw data into actionable insights to improve team performance. Implementation success depends on establishing clear processes, choosing the right tools, and creating a culture where metrics drive improvement rather than punishment.
Establish clear measurement routines and ownership to ensure consistent data collection. Assign specific team members responsibility for tracking each metric. Define exactly when and how data gets recorded. Daily standup updates work for fast-moving metrics like task completion. Weekly reviews suit cycle time and quality indicators. Monthly analysis fits engagement and financial metrics. Consistency matters more than frequency.
- Define your strategic objectives and identify which metrics directly measure progress toward those goals
- Select 5 to 8 core metrics that cover efficiency, quality, cost, and engagement without creating measurement overload
- Choose software tools that automate data collection and provide real-time visualization of trends and patterns
- Establish regular review cadences where teams analyze metrics together and identify improvement opportunities
- Communicate results transparently and celebrate improvements to build a culture of continuous enhancement
- Review and refine your metric set quarterly to ensure alignment with evolving priorities and eliminate outdated indicators
Choose software tools to automate data collection and visualization. Manual tracking creates delays, errors, and resentment. Modern platforms pull data directly from work systems, calculate metrics automatically, and display trends in real time. This automation frees managers to focus on analysis and action rather than spreadsheet maintenance. Look for tools that integrate with your existing workflow rather than requiring duplicate data entry.
Analyze trends over time to identify improvement opportunities rather than fixating on single data points. A bad week doesn't indicate a broken process. Three consecutive months of decline signals a real problem. Plot metrics on time series charts to spot patterns. Look for correlations between different metrics. Does quality drop when productivity spikes? Does engagement fall before turnover rises? These patterns reveal root causes and guide targeted interventions.
Communicate metrics transparently with teams to foster accountability and ownership. Share dashboards openly rather than keeping them in management meetings. Explain what each metric measures and why it matters. Discuss trends together and ask teams for improvement ideas. Transparency builds trust and transforms metrics from management surveillance into team tools for self-improvement.
Iterate and refine metrics to remain aligned with evolving goals and market conditions. What worked last year might not fit this year's priorities. Add metrics when new challenges emerge. Remove metrics that no longer drive decisions. Update targets as capabilities improve. This continuous refinement keeps your measurement system relevant and prevents teams from gaming outdated indicators that no longer matter.
Streamline your performance management with Outsprinter
Tracking performance metrics manually creates delays and errors that undermine the insights you need for effective team management. Outsprinter's team performance and sprint management platform provides integrated tools for real-time KPI tracking, task management, and project oversight in one unified system. You gain instant visibility into team productivity, project health, and goal progress without juggling multiple spreadsheets or tools.
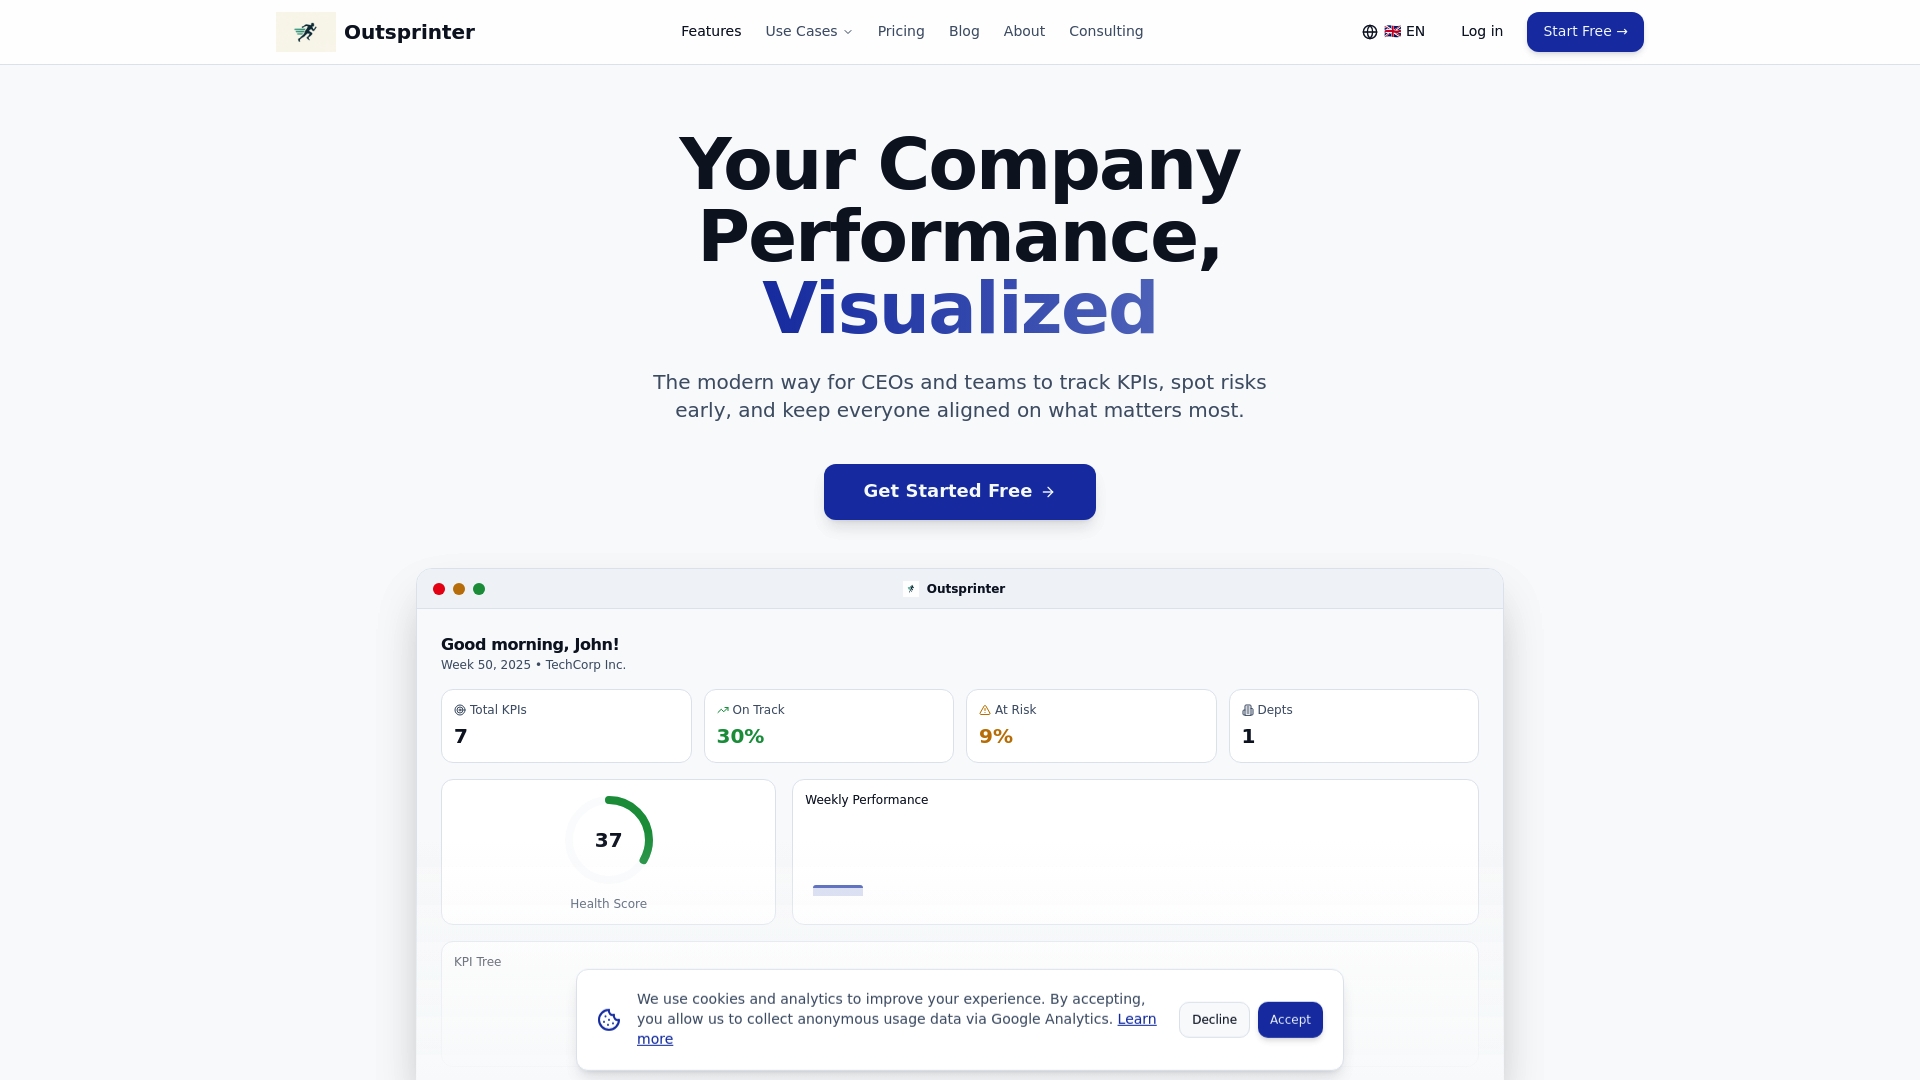
The platform's dashboard updates automatically as teams enter data, giving you current performance snapshots whenever you need them. KPI management features let you define custom metrics, track them across your organization, and visualize trends that reveal opportunities for improvement. Project management capabilities help you organize work, analyze workload distribution, and monitor progress toward strategic targets. Choose Outsprinter to transform raw activity into actionable intelligence that drives better decisions and measurable productivity gains.
Frequently asked questions
What are the most common types of performance metrics?
The most common types include efficiency metrics like cycle time and throughput, quality metrics such as defect density and accuracy rates, timeliness indicators like on-time delivery percentage, engagement measures including satisfaction scores and retention rates, and cost metrics such as budget variance and cost performance index. Each type reveals different performance dimensions, so effective measurement systems typically combine multiple types to create a balanced view of team and project health.
How often should businesses review their performance metrics?
Review frequency depends on metric type and project pace. Fast-moving teams benefit from weekly reviews of productivity and quality metrics to catch issues early. Monthly reviews work well for engagement and financial indicators that change more gradually. Conduct comprehensive quarterly reviews to assess whether your entire metric set still aligns with current strategic priorities. More frequent checks support agility, but avoid daily metric obsession that creates anxiety without enabling meaningful action.
Can performance metrics improve employee engagement?
Properly designed metrics absolutely improve engagement by providing clear feedback, recognition opportunities, and visible progress toward goals. Transparent metric sharing builds trust and helps teams understand how their work contributes to larger objectives. Metrics create accountability that high performers appreciate and use for self-improvement. However, poorly implemented metrics that feel punitive or track meaningless activity damage engagement. The key is choosing metrics that teams can influence and using them to support development rather than punishment.
What tools can help track performance metrics effectively?
Software platforms can automate KPI tracking, dashboards, and reporting for improved decision making. Purpose-built solutions like Outsprinter integrate task management, project tracking, and KPI visualization in unified systems that eliminate manual data entry. These platforms pull metrics directly from work activities, calculate trends automatically, and display results in real-time dashboards. Benefits include reduced administrative burden, faster insight generation, and better data accuracy compared to spreadsheet-based tracking. Look for tools that integrate with your existing workflow and provide mobile access for on-the-go monitoring.