
Many business leaders assume that collecting data is enough to drive team performance. They invest in analytics platforms, track dozens of metrics, and generate detailed reports. Yet teams still miss deadlines, priorities remain unclear, and decision-making feels slow. The missing piece isn't more data, it's performance visualization that transforms raw numbers into clear, actionable insights. This guide explains what performance visualization is, how to design effective visual systems, and practical ways to apply these tools to enhance team productivity and project outcomes.
Table of Contents
- Key takeaways
- Understanding performance visualization and its impact
- Best practices in designing effective performance visualizations
- The role of user focus and behavioral insights in visualization success
- Applying performance visualization to enhance team and project management
- Explore Outsprinter for powerful performance visualization
- Frequently asked questions
Key Takeaways
| Point | Details |
|---|---|
| Real time dashboards | Interactive dashboards and charts enable monitoring performance in real time and driving action. |
| Reduces cognitive load | Well designed visuals reduce cognitive load, enabling faster understanding and better teamwork. |
| Visual hierarchy and color coding | Visual hierarchy places key KPIs where users naturally look first to highlight priorities. |
| Test and refine visuals | Ongoing testing and refinement ensure visuals actually drive action and improve usability. |
Understanding performance visualization and its impact
Performance visualization uses data visualization techniques to represent key performance indicators, project progress, and team metrics through interactive dashboards and charts. Unlike static spreadsheets or text reports, these visual tools enable leaders to monitor performance, analyze trends, and drive action in real time. The approach transforms abstract numbers into visual patterns that human brains process far more quickly than tables of figures.
The primary tools include interactive dashboards that aggregate multiple metrics in one view, real-time charts that update as data changes, and drill-down interfaces that let users explore details without losing context. These elements work together to create a comprehensive view of organizational performance that supports both high-level oversight and detailed investigation.
Leaders gain several critical benefits from effective performance visualization. First, clarity improves dramatically when complex data becomes visual patterns. Teams immediately see which projects are on track, which KPIs need attention, and where bottlenecks exist. Second, decision-making accelerates because visual formats eliminate the need to interpret raw numbers or wait for manual report generation. Third, transparency increases as everyone views the same performance picture, reducing misalignment and enabling more productive conversations about priorities and resource allocation.
Experts emphasize that well-designed visualizations reduce cognitive load by presenting information in formats that match how people naturally process visual information. This cognitive efficiency translates directly into better collaboration, as team members can quickly establish shared understanding and focus discussions on solutions rather than clarifying what the data means. The impact extends beyond individual productivity to fundamentally improve how teams coordinate and execute on strategic objectives.
Best practices in designing effective performance visualizations
Creating performance visuals that actually improve decision-making requires following specific design principles that prioritize clarity and action. Visual hierarchy places the most critical KPIs in the top-left position where eyes naturally start scanning, ensuring leaders immediately see what demands attention. This positioning isn't arbitrary, it leverages established patterns of how people consume visual information.
Progressive disclosure prevents overwhelming users by showing summary metrics first, then allowing drill-down into details only when needed. A dashboard might display overall project health at the top level, with the ability to click through to individual task status or team workload analysis. This layered approach keeps the initial view clean while preserving access to deeper insights.
Context transforms raw numbers into meaningful performance indicators. Displaying a KPI value without benchmarks or targets leaves users guessing whether performance is acceptable. Effective visualizations include comparison points like historical trends, targets, or peer benchmarks so viewers instantly understand whether current performance meets expectations. A sales metric showing $50,000 means little without knowing if the target was $40,000 or $60,000.
Color coding provides instant status recognition when applied consistently. The standard convention uses green for on-track performance, yellow for warning states, and red for critical issues requiring immediate attention. These colors should align with defined thresholds that reflect actual business impact rather than arbitrary percentages. Consistency across all visualizations ensures users don't need to relearn color meanings in different contexts.
Interactivity features like filters, date range selectors, and drill-down capabilities transform static displays into exploration tools. Users can isolate specific teams, time periods, or project types to investigate patterns and answer emerging questions without requesting custom reports. This self-service capability dramatically reduces the lag between question and answer.
| Design element | Practical effect | Implementation tip |
|---|---|---|
| Visual hierarchy | Guides attention to critical metrics first | Place highest-priority KPIs top-left, use size and contrast |
| Progressive disclosure | Prevents information overload | Show summaries with expandable details on demand |
| Contextual benchmarks | Makes performance meaningful | Always include targets, trends, or comparisons |
| Consistent color coding | Enables instant status recognition | Use green/yellow/red aligned to business thresholds |
| Interactive filters | Supports ad-hoc exploration | Provide date, team, and category filters on all dashboards |
Pro Tip: Test your visualizations with actual end users before full deployment. Watch them interact with the dashboard and ask what decisions they can make based on what they see. If users can't quickly identify what action to take, the design needs refinement regardless of how visually appealing it appears.
The role of user focus and behavioral insights in visualization success
The most sophisticated visualizations fail if they don't influence actual decisions. Every visual element must serve the specific decisions users need to make, whether that's reallocating resources, adjusting priorities, or escalating issues. This user-decision focus requires understanding what questions leaders actually ask and what actions they can take based on the answers.
Cognitive load reduction happens when visualizations eliminate the mental effort required to interpret data. When a chart clearly shows that Project A is falling behind while Project B has excess capacity, the reallocation decision becomes obvious. The visualization does the interpretive work, freeing mental energy for strategic thinking rather than data analysis. This efficiency compounds across an organization when multiple team members can quickly grasp performance status without lengthy explanations.
Collaboration improves dramatically when teams share visual understanding. Instead of debating what the numbers mean, discussions can focus on why patterns exist and what to do about them. A shared dashboard creates common ground where different perspectives can build on the same factual foundation. This shared context is particularly valuable for high-performing leadership teams that need to coordinate across functions.
Testing with actual users reveals whether visualizations achieve their intended purpose. Designers often create visually impressive dashboards that don't actually help users make better decisions. Watching real team members interact with the tools exposes confusion points, missing information, and opportunities for simplification. This validation step should happen before wide deployment and continue iteratively as usage patterns emerge.
Monitoring usage analytics provides ongoing insight into which visualizations deliver value and which get ignored. Track metrics like view frequency, time spent, filter usage, and drill-down patterns to understand how teams actually use the tools. Low engagement with specific dashboards signals either poor design or misalignment with actual decision needs. High engagement with certain features indicates where to invest in enhancement.
Experts emphasize that visualization design is never truly finished. User needs evolve, business priorities shift, and new data sources become available. The most effective organizations treat performance visualization as an iterative process, continuously refining based on feedback and behavioral data rather than treating dashboards as one-time deliverables.
Pro Tip: Schedule quarterly reviews of your performance visualizations with key users. Ask what decisions they're making, what information they wish they had, and what elements they never use. This regular feedback loop ensures your visualizations evolve with your business rather than becoming stale artifacts.
Applying performance visualization to enhance team and project management
Implementing performance visualization in team management requires a systematic approach that moves from strategy to execution. Start by identifying the key decisions leaders need to make regularly, such as resource allocation, priority adjustments, or risk mitigation. These decisions determine which metrics matter and how they should be visualized.

Next, define clear KPIs that directly measure progress toward strategic goals. Avoid vanity metrics that look impressive but don't drive action. Focus on indicators that reflect actual team performance and project health. Each KPI needs defined thresholds that trigger different responses, ensuring the visualization prompts appropriate action.
Select visualization tools that support real-time updates and interactive exploration. Static reports quickly become outdated and don't support the dynamic nature of modern project management. Platforms that integrate with existing work management systems eliminate manual data entry and ensure accuracy.
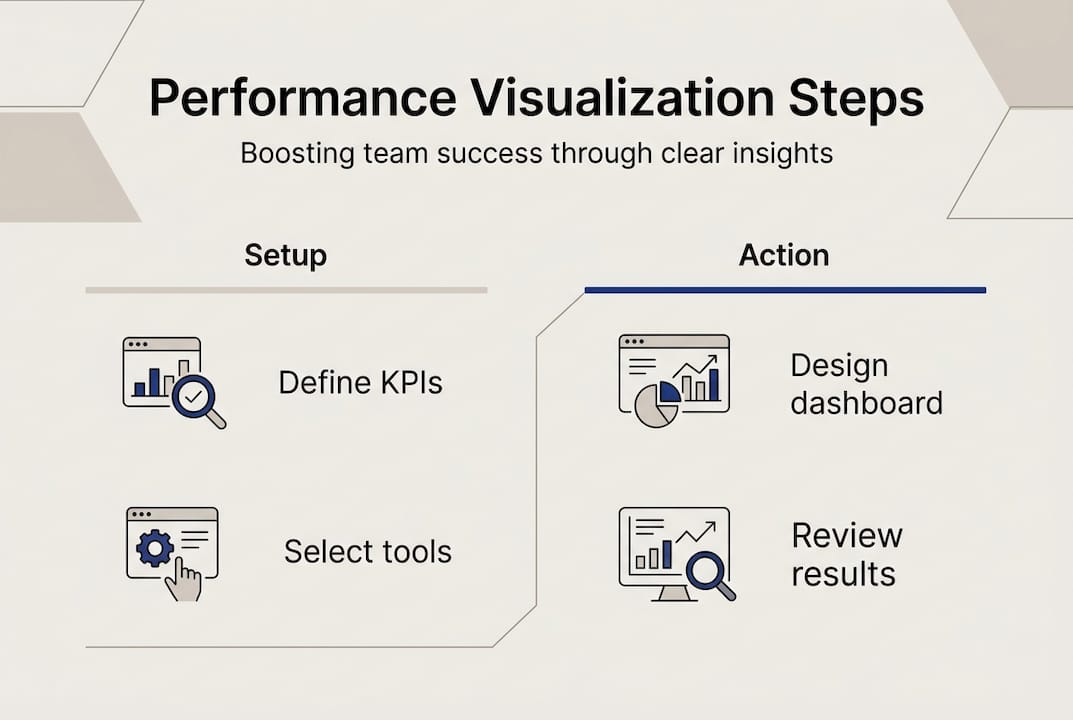
Design dashboards with clear visual hierarchy, placing critical metrics prominently and supporting details in secondary positions. Include contextual information like trends, benchmarks, and targets so viewers understand performance relative to expectations. Apply consistent color coding and interaction patterns across all visualizations to reduce learning curves.
Train team members not just on how to read visualizations but on what actions to take based on what they see. A dashboard showing a red KPI should trigger specific responses, whether that's escalating to leadership, reallocating resources, or adjusting timelines. Clear action protocols turn visualization from information display into decision support.
Establish regular review cadences where teams examine performance visualizations together. These sessions create accountability, surface issues early, and build shared understanding of priorities. The visual format makes these meetings more efficient by eliminating time spent clarifying data and allowing focus on solutions.
| Approach | Traditional reporting | Visualization-driven management |
|---|---|---|
| Information delivery | Periodic static reports | Real-time interactive dashboards |
| Decision speed | Delayed until report generation | Immediate based on current data |
| Team alignment | Varies based on report interpretation | Shared visual understanding |
| Issue detection | Retrospective in review meetings | Proactive through continuous monitoring |
| Exploration capability | Requires custom report requests | Self-service drill-down and filtering |
Common scenarios where visualization enhances management include sprint planning, where teams see capacity and velocity trends to set realistic commitments. Resource allocation improves when leaders visualize workload distribution across team members. Risk management becomes proactive when dashboards surface early warning indicators before issues become critical. IT teams particularly benefit from visualizing incident patterns, deployment frequency, and system health metrics.
Technology platforms designed for team performance management provide purpose-built visualization capabilities that integrate with task tracking, goal planning, and KPI management. These integrated systems eliminate data silos and ensure visualizations reflect the complete picture of team performance rather than fragmented snapshots.
Continuous refinement based on team feedback ensures visualizations remain relevant as priorities evolve. Regularly solicit input on what's working, what's missing, and what's no longer needed. This iterative approach keeps performance visualization aligned with actual management needs rather than becoming static displays that lose relevance over time.
Explore Outsprinter for powerful performance visualization
Business leaders seeking to implement the performance visualization strategies covered in this guide need platforms built specifically for team performance management. Outsprinter delivers real-time dashboards that update instantly as teams enter data, eliminating the lag between action and insight that undermines decision-making.
The platform combines interactive KPI tracking with project health metrics and workload analysis, giving leaders comprehensive visibility into team performance. Visual hierarchy and color-coded status indicators make critical information immediately apparent, while drill-down capabilities support detailed investigation when needed. IT teams and cross-functional groups use Outsprinter to align on priorities, track sprint progress, and identify bottlenecks before they impact delivery.
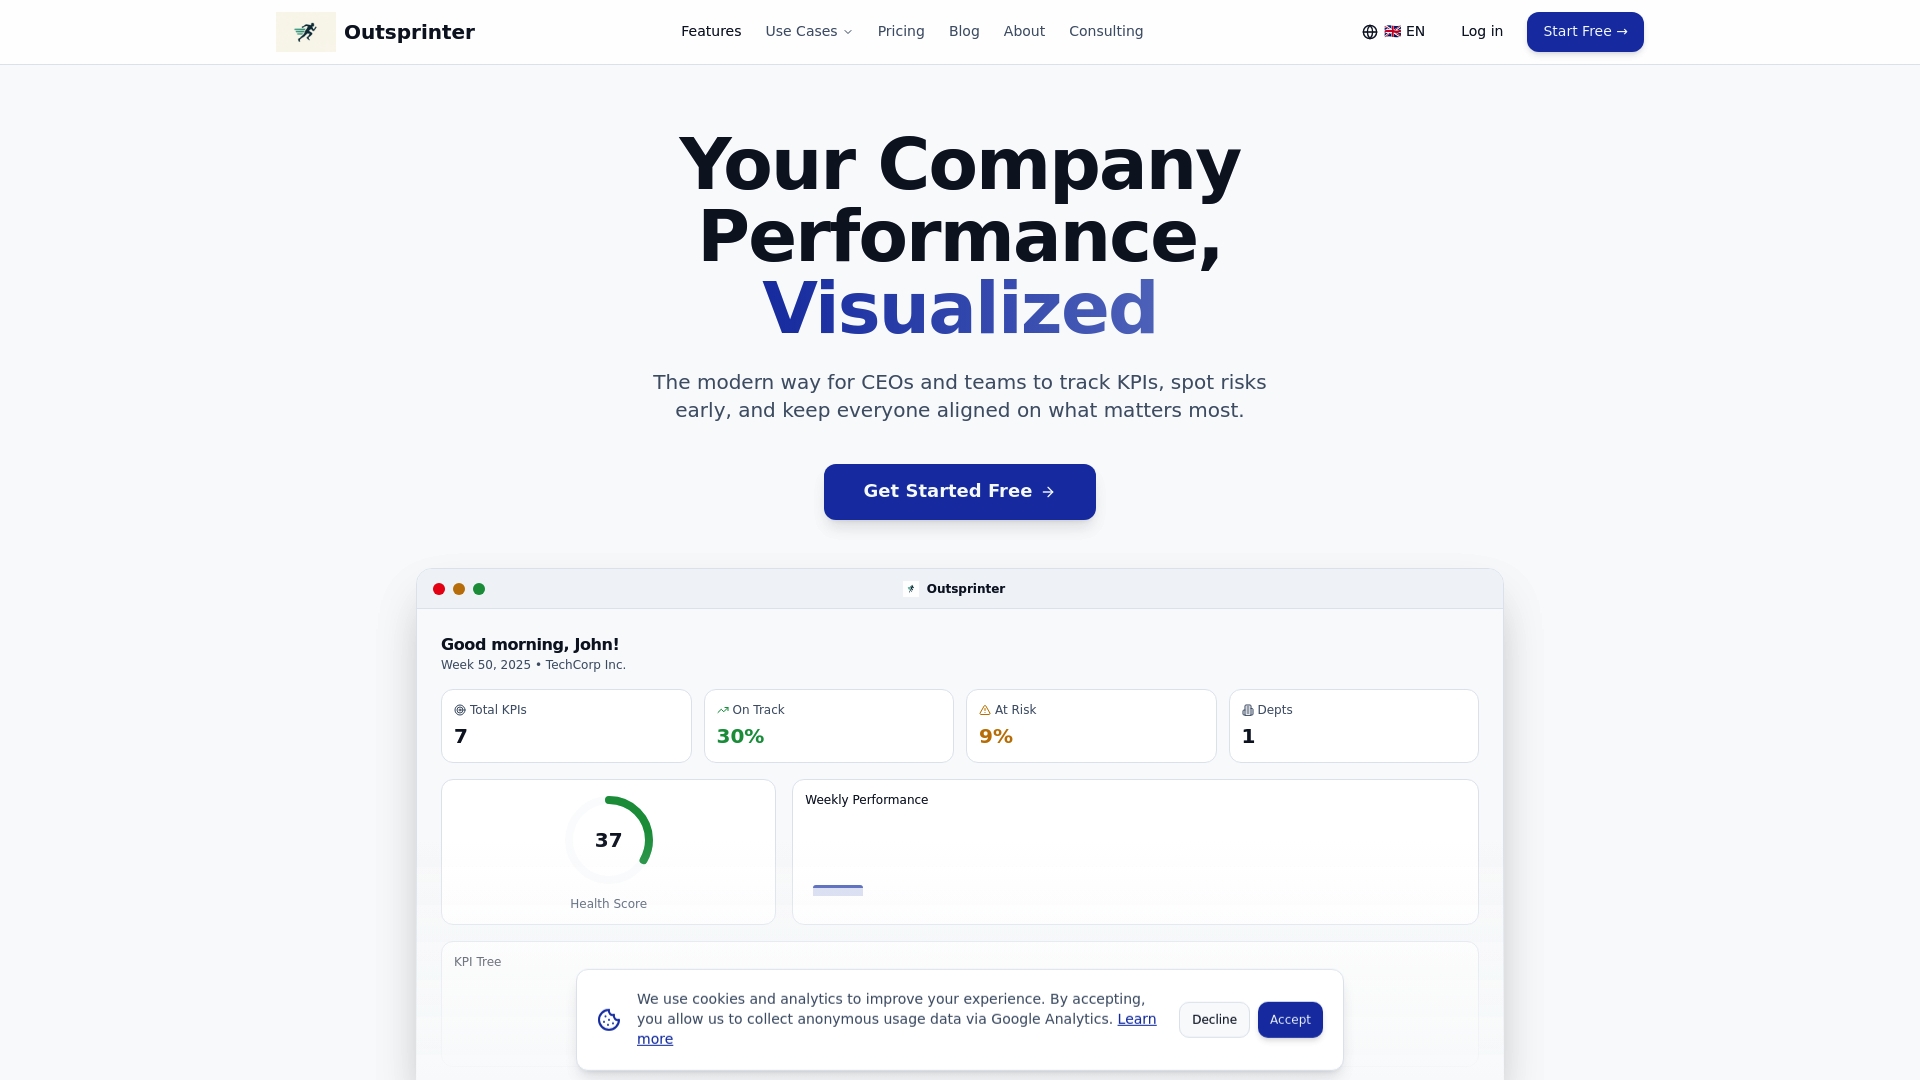
Outsprinter's goal planner connects strategic objectives to weekly execution, visualizing progress toward annual targets in formats that drive accountability. The AI assistant analyzes performance patterns and suggests optimizations, turning visualization from passive display into active decision support. Organizations report faster response times to emerging issues and improved collaboration as teams rally around shared visual understanding of performance status.
Frequently asked questions
What is performance visualization?
Performance visualization is the practice of using charts, dashboards, and interactive displays to represent key performance indicators, project progress, and team metrics in visual formats. It transforms raw data into patterns and trends that leaders can quickly understand and act upon.
How does visualization differ from traditional reporting?
Traditional reports present data in tables and text that require interpretation, while visualization uses visual elements like charts and color coding to make patterns immediately apparent. Visualizations also support real-time updates and interactive exploration that static reports cannot provide.
What tools are typically used for performance visualization?
Common tools include interactive dashboards that aggregate multiple metrics, real-time charts that update as data changes, and drill-down interfaces that allow detailed exploration. Modern platforms integrate these elements with task management and goal tracking systems.
How does performance visualization improve decision-making?
Visualization reduces the cognitive load required to interpret data, allowing leaders to grasp performance status at a glance. This speed enables faster responses to emerging issues and more informed resource allocation decisions based on current rather than outdated information.
What are the first steps to implement performance visualization?
Start by identifying key decisions leaders need to make regularly, then define KPIs that directly inform those decisions. Select tools that support real-time updates and interactive features, design dashboards with clear visual hierarchy, and train teams on interpreting visuals and taking appropriate actions based on what they see.