
TL;DR:
- Most organizations mistake superficial dashboards for true performance insights, risking misaligned actions. Effective monitoring ties data to strategic goals, facilitates accountability, and promotes continuous improvement. Poor metrics, infrequent reviews, or dashboard neglect can obscure real issues, emphasizing the need for deliberate, hypothesis-driven KPI management.
Most managers believe their dashboards tell the full story. Green lights, steady progress bars, and tidy weekly reports create a comforting sense of control. But that feeling can be dangerously misleading. Real departmental monitoring is not about collecting numbers — it is about generating the kind of insight that forces action, surfaces hidden problems, and keeps every team aligned with what actually matters to the business. When organizations treat monitoring as a checkbox exercise, accountability erodes quietly and results slip before anyone notices. This guide breaks down what genuine monitoring looks like, why it pays off, and exactly how to do it right.
Table of Contents
- The fundamentals: What does monitoring departments really mean?
- Key benefits: Why monitoring drives accountability and results
- Pitfalls and edge cases: What can go wrong with departmental monitoring?
- Best practices: How to monitor departments for real performance gains
- A candid perspective: Most monitoring efforts miss the point
- Enhance your departmental monitoring with Outsprinter
- Frequently asked questions
Key Takeaways
| Point | Details |
|---|---|
| Accountability through oversight | Monitoring ensures teams are held responsible and supports continuous improvement. |
| Better outcomes with incentives | Linking performance data to clear goals and rewards can drive real department gains. |
| Avoid misleading metrics | Metrics must closely match actual team and user outcomes to prevent false confidence. |
| Focus on adaptive learning | Effective monitoring is less about reporting and more about learning and adjusting strategies. |
| Apply proven frameworks | Use best practices to keep monitoring aligned with organizational priorities. |
The fundamentals: What does monitoring departments really mean?
Departmental monitoring is one of those phrases that sounds self-explanatory until you try to define it precisely. Most people assume it means looking at reports. It is actually a structured, ongoing practice that ties data collection to accountability structures, strategic targets, and responsive action.
Think of passive reporting as a weather station that records temperature but never triggers an alarm. Active monitoring is the system that reads those same numbers and automatically alerts the team when conditions become dangerous. The difference is not the data — it is what happens next.
According to the U.S. Office of Personnel Management, department-level oversight is tied to accountability, transparency, and continuous improvement. That framing matters. It positions monitoring not as surveillance but as a tool for organizational learning and growth.
Effective departmental monitoring typically covers three core areas:
- KPI tracking: Measuring the specific indicators that reflect whether a department is meeting its goals, whether that is customer response time, project completion rate, or revenue generated per team member
- Compliance with timelines and rules: Confirming that work is completed within agreed deadlines and in line with organizational policies
- Actionable insight generation: Translating raw numbers into specific recommendations — not just "sales dropped 8%" but "sales dropped 8% in Q3 because lead follow-up time increased by two days"
The third point is where most organizations fall short. Data without interpretation is just noise. When you commit to boosting KPI results at the department level, the goal is always to move from observation to informed decision-making. That shift is what separates genuine monitoring from performative reporting.
"Effective monitoring is not about watching teams — it is about creating conditions where teams can see their own performance clearly and act on it with confidence."
Key benefits: Why monitoring drives accountability and results
Once you understand what monitoring actually involves, the case for doing it well becomes obvious. But let's go beyond the obvious and look at what research and real organizational experience tell us about the concrete returns.
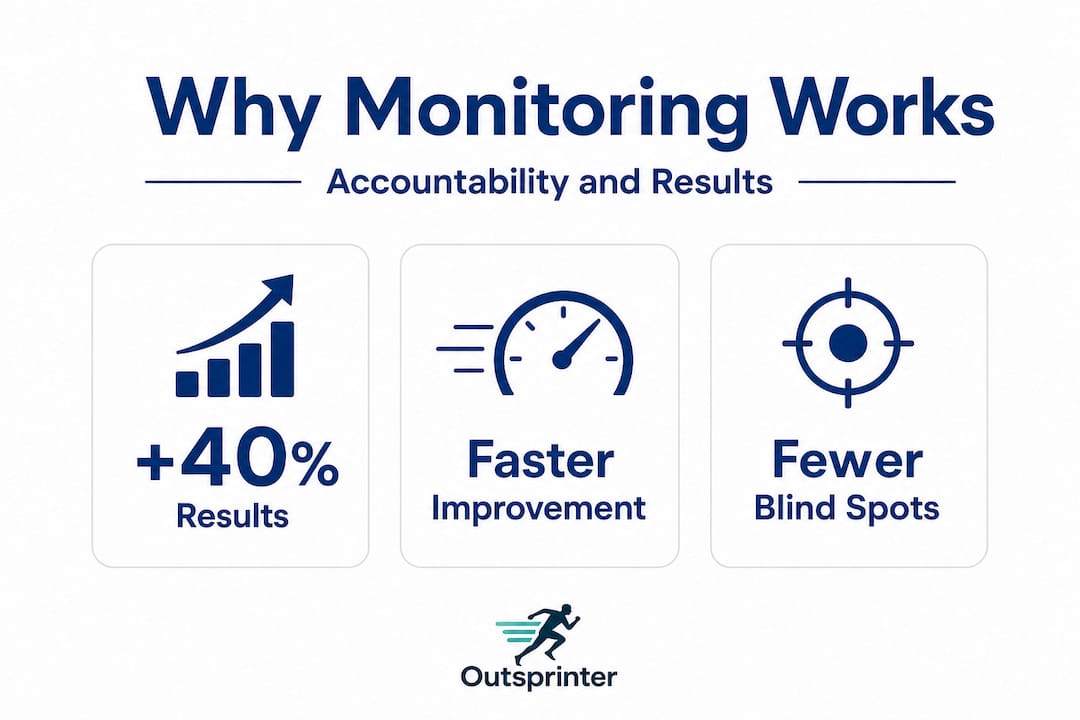
The clearest benefit is accountability. When teams know their performance is being measured against specific, visible targets, behavior changes. Not because people fear punishment, but because clarity creates direction. People work better when they understand what "good" looks like and can see their own progress in real time.
Here are the core benefits, in order of organizational impact:
- Transparency across departments: When performance data is visible and consistent, political disagreements about "whose fault it was" become much rarer. Shared data creates shared responsibility.
- Faster identification of underperformance: Problems caught early cost far less to fix. A department missing its targets by 5% in month two is a coaching conversation. The same department missing by 30% in month six is a crisis.
- Continuous improvement culture: Regular feedback loops push teams to analyze what worked, what did not, and what to adjust. Over time, this habit compounds into measurably better performance.
- Better resource allocation: When you can see which departments are operating efficiently and which are stretched, you make smarter decisions about where to invest time, budget, and people.
Research backs this up with hard data. A study published in Health Care Management Review found that performance-based monitoring tied to predefined thresholds can meaningfully improve quality outcomes in organizational sub-units, including military hospitals where performance-based budgeting drove measurable gains in care quality. The mechanism is straightforward: when thresholds are clear and consequences are tied to results, teams focus on the right things.
| Monitoring approach | Accountability level | Improvement speed | Risk of blind spots |
|---|---|---|---|
| No formal monitoring | Low | Slow | Very high |
| Passive reporting only | Medium | Moderate | High |
| Active KPI monitoring | High | Fast | Low |
| Adaptive monitoring with feedback | Very high | Fastest | Minimal |
Understanding how leadership teams use KPIs differently from average organizations reveals a consistent pattern: top performers use metrics to ask better questions, not to confirm existing assumptions.
Pro Tip: Before you assign KPIs to a department, define the threshold that separates "on track" from "needs attention." Vague targets produce vague effort. Clear thresholds produce focused action. Consider also how many KPIs to track so you do not overwhelm teams with measurement for its own sake.
Pitfalls and edge cases: What can go wrong with departmental monitoring?
Here is the uncomfortable reality: many organizations invest significant time in building monitoring systems that deliver false confidence rather than real insight. Knowing what can go wrong is just as important as knowing what to do right.
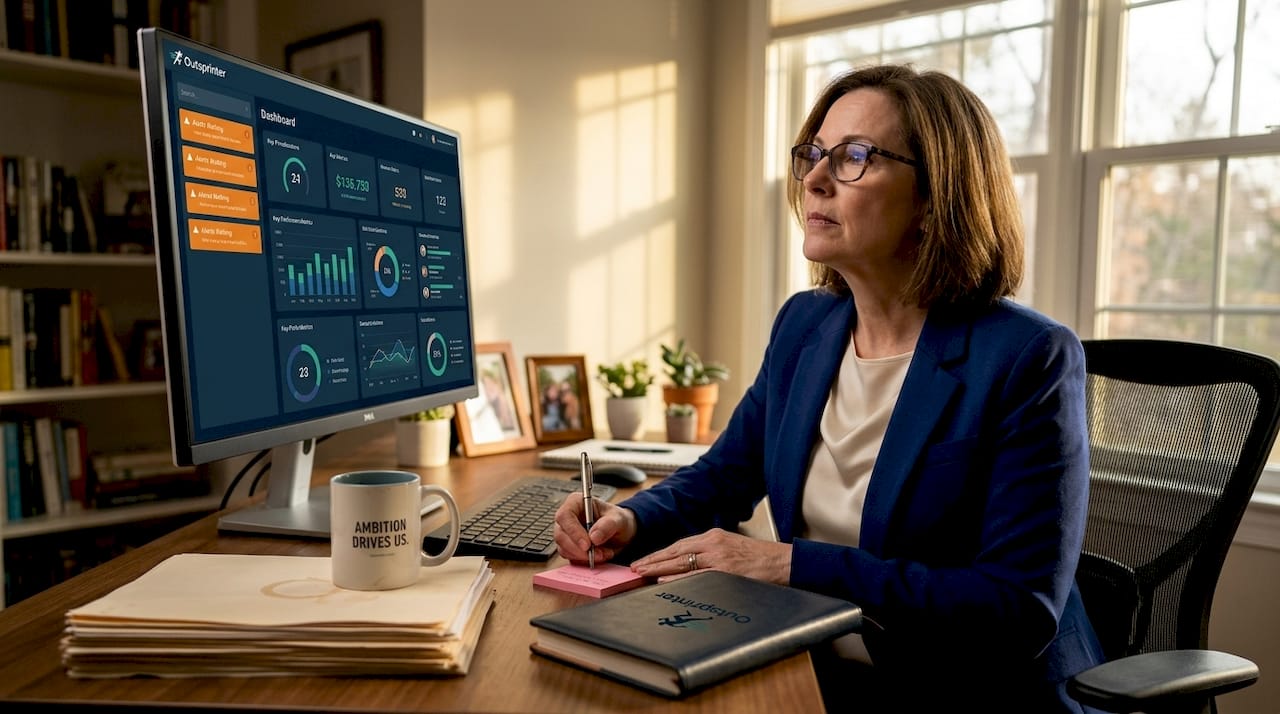
The most common mistake is selecting metrics that look neat on a dashboard but do not actually reflect team output or user satisfaction. A customer service department might track average handle time obsessively while customer satisfaction scores quietly decline. The dashboard looks great. The business is quietly losing clients.
This problem extends to technical monitoring systems as well. Research on network performance monitoring found that dashboards can show "green" while serious user-impact issues remain completely undetected. The principle applies directly to departmental oversight: a metric that is easy to measure is not necessarily a metric that matters.
The Balanced Scorecard (BSC) framework, one of the most widely adopted monitoring approaches, illustrates the social and structural risks. Research published in Problems and Perspectives in Management found that BSC implementations frequently encounter conceptual problems, technical barriers, and significant social or political resistance. Too much focus on measurement can actually crowd out the strategic thinking it was meant to support.
Common monitoring pitfalls worth watching for:
- Metric gaming: Teams optimize for the metric rather than the underlying goal. If bonuses are tied to call volume, agents will rush calls. If bonuses are tied to resolution rate, agents will close tickets prematurely.
- Dashboard theater: Beautiful reports that nobody acts on. Leadership reviews numbers, nods, and moves on without triggering any change in behavior or resource allocation.
- Lagging-only indicators: Tracking only outcome metrics like revenue or defect rate means you only discover problems after they have already happened. You need leading indicators to catch issues early.
- Inconsistent review cycles: Monthly reviews miss weekly fluctuations. Quarterly reviews miss monthly trends entirely. The frequency of monitoring must match the speed at which your business moves.
"The danger is not that you are watching the wrong things — it is that you do not know you are watching the wrong things."
Understanding why most KPIs fail before you design your monitoring system is one of the most valuable investments you can make. Prevention is always cheaper than rebuilding.
| Monitoring mistake | What it looks like | Actual risk |
|---|---|---|
| Vanity metrics | High page views, low conversions | Misallocated resources |
| Metric gaming | Perfect scores, poor outcomes | Loss of trust and quality |
| Lagging indicators only | Revenue reports, no early warnings | Late response to problems |
| No review cadence | Reports exist, no action taken | Monitoring becomes ceremonial |
Pro Tip: Every quarter, run a "KPI audit." Ask each department to confirm that their current metrics still reflect actual business priorities. Markets shift, strategies evolve, and metrics that made sense last year may be pointing teams in the wrong direction today.
Best practices: How to monitor departments for real performance gains
Knowing the pitfalls is useful. Knowing exactly what to do instead is what creates results. Here is a concrete framework for building a monitoring system that generates genuine accountability and measurable improvement.
-
Start with strategic goals, then cascade downward. Every department metric should trace back to an organizational priority. If your company goal is to reduce customer churn by 15%, your customer success department's KPIs should include metrics like renewal rate, time to first value, and proactive outreach frequency — all of which directly influence churn. Starting with the business question and working backward to the metric prevents the common problem of departments optimizing for irrelevant outputs.
-
Use both leading and lagging indicators. Lagging indicators (revenue, defect rate, employee turnover) tell you what already happened. Leading indicators (pipeline size, training completion rate, ticket backlog growth) tell you what is about to happen. Research on metric choice and aggregation confirms that when metric selection is poorly connected to real outcomes, dashboards produce false reassurance. Design measures that reflect both predictive signals and final outcomes.
-
Set review cadences that match business velocity. A fast-moving sales team probably needs weekly KPI reviews. An engineering team running two-week sprints might review at the sprint level. Match your monitoring rhythm to the natural tempo of each department's work.
-
Build feedback loops, not just reporting loops. After every review cycle, there should be a clear process: what do the numbers mean, what action is required, who owns it, and when will you check progress? Without this loop, monitoring is just documentation. Weekly KPI tracking done well includes a structured review conversation, not just a data pull.
-
Adjust KPIs as context changes. A KPI that was perfect during a growth phase may be counterproductive during a cost-control phase. Build periodic KPI reviews into your operating rhythm. Knowing how to set KPI thresholds properly, including the green, yellow, and red zones, gives teams immediate visual feedback on where they stand without waiting for a manager's interpretation.
Pro Tip: For every metric on your dashboard, write a one-sentence answer to this question: "What business decision would change if this number moved by 20%?" If the answer is "nothing," remove the metric. Link every number to a real decision point.
A candid perspective: Most monitoring efforts miss the point
After working through the frameworks and research, here is what we actually believe: the majority of monitoring programs in organizations are not measuring performance. They are measuring the appearance of performance.
Leaders get comfortable with green dashboards. The reports come in, the numbers look acceptable, and the meeting moves on to the next agenda item. Meanwhile, the team is gaming metrics, the real problems are invisible, and strategy is getting crowded out by the administrative weight of measurement itself.
The most valuable shift you can make is to stop asking "Are we on track?" and start asking "What are we actually learning from this data?" Those two questions look similar but produce completely different conversations. The first question produces defensiveness and justification. The second question produces curiosity and adjustment.
The organizations that use monitoring most effectively treat their KPIs as hypotheses, not verdicts. They say, "We believe that if we improve response time, customer satisfaction will rise. Let's monitor both and see if the relationship holds." When it does not hold the way they expected, that is not a failure. That is the most valuable piece of information they could have gathered.
Avoiding KPI overload is often the first step toward this kind of clarity. Fewer, better metrics create space for real thinking. Dozens of metrics create noise that makes real thinking nearly impossible.
The uncomfortable truth is that monitoring done poorly is worse than no monitoring at all. It consumes time, generates reports nobody reads, and creates the illusion of oversight while real accountability erodes. The bar for doing monitoring well is high. But for organizations willing to meet it, the returns in team performance, strategic clarity, and organizational trust are genuinely transformative.
Enhance your departmental monitoring with Outsprinter
Translating these best practices into daily operations requires more than good intentions — it requires the right infrastructure.
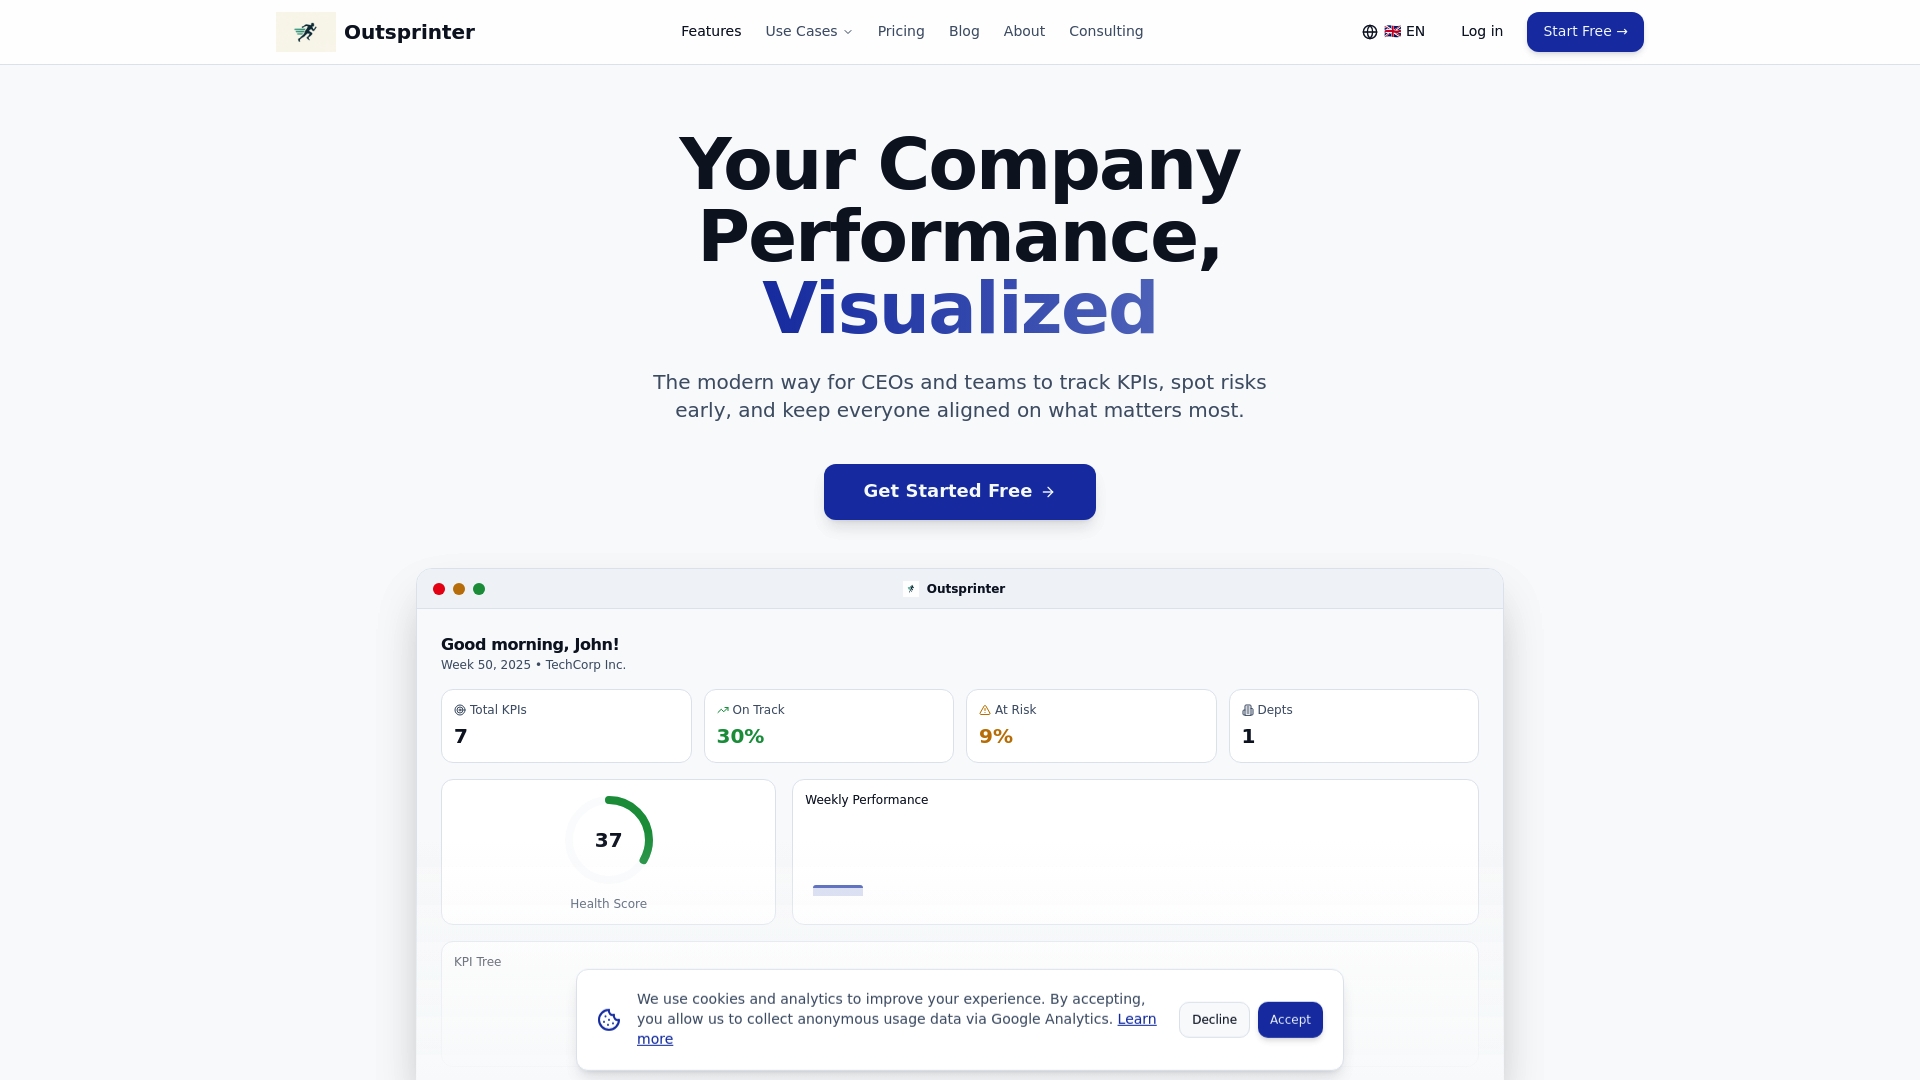
Outsprinter brings together everything your teams need to monitor performance with precision and purpose. The real-time KPI management tools let you define indicators, set thresholds, and visualize performance across every department from a single dashboard that updates instantly as teams enter data. When a metric moves into the yellow or red zone, alerts fire automatically so you can respond before a trend becomes a crisis. The project management tools add workload analysis and health metrics, giving you a layered view of both task-level execution and strategic outcomes. The built-in AI Assistant helps you design better KPIs, interpret patterns, and identify what your data is actually telling you. If you are serious about turning monitoring into a genuine performance advantage, the Outsprinter platform gives you the structure to make it stick.
Frequently asked questions
What is the primary goal of monitoring departments?
The primary goal is to drive accountability, transparency, and continuous improvement by using performance data to inform specific, timely actions rather than simply documenting outcomes after the fact.
How do I choose the right KPIs for my department?
Select KPIs that connect directly to strategic goals and include both leading indicators (predictive signals) and lagging indicators (outcome measures), and revisit them regularly since research confirms that metric design must reflect real outcomes and adapt as business context evolves.
Can monitoring create false reassurance?
Yes, and it is more common than most leaders realize. When metrics are disconnected from actual user or team outcomes, dashboards can show "green" while significant problems go completely undetected beneath the surface.
What are common obstacles to effective monitoring?
The most frequent barriers include over-focus on measurement at the expense of strategy, technical complexity in building useful dashboards, and social or political resistance from teams who feel monitored rather than supported.