
TL;DR:
- Most executive teams believe their dashboards effectively track growth, but numbers alone can be misleading.
- Understanding and focusing on actionable, context-aware metrics enables better decision-making and sustainable organizational progress.
Most executive teams believe they're tracking organizational growth effectively because their financial dashboards are full of numbers. The uncomfortable truth is that a full dashboard doesn't mean a clear picture. Many CEOs rely on default financial KPIs inherited from previous leadership cycles, never questioning whether those numbers actually reveal what's happening inside the organization. This guide cuts through the noise, defines what organizational growth metrics really are, explains the ones that matter most, and shows you how to turn measurement into decisions that move the needle.
Table of Contents
- What are organizational growth metrics?
- Decoding core financial growth metrics
- Hidden traps: context, scale, and the Rule of 40
- Beyond finance: The vital role of human and meaning metrics
- From measurement to action: Turning growth metrics into decisions
- The overlooked art: Choosing what not to measure
- Level up your metrics strategy with Outsprinter
- Frequently asked questions
Key Takeaways
| Point | Details |
|---|---|
| Metrics must fit context | Financial growth metrics matter, but CEOs should always interpret them within size, sector, and peer benchmarks. |
| Look beyond finance | Leading indicators like employee engagement and alignment often predict financial outcomes before classic KPIs. |
| Beware growth traps | High growth percentages can mislead at scale, so pair with absolute numbers and advanced frameworks like the Rule of 40. |
| Drive action, not just tracking | Growth metrics are only valuable when they inform real strategic decisions and operational changes. |
| Choose wisely what to measure | Relentless focus on a few meaningful metrics outperforms tracking many for the sake of completeness. |
What are organizational growth metrics?
Organizational growth metrics are the quantitative signals that reveal whether your company is expanding, stagnating, or quietly declining. They fall into two broad categories: financial metrics, which capture outcomes like revenue and profitability, and operational metrics, which track the processes, people, and activities that drive those outcomes.
The most commonly tracked core financial KPIs at the executive level include:
- Revenue Growth Rate — the pace at which top-line income is increasing
- EBITDA Margin — earnings before interest, taxes, depreciation, and amortization as a percentage of revenue
- Net Profit Margin — what remains after all expenses, expressed as a percentage of revenue
- Operating Cash Flow — cash generated by core operations, separate from financing activities
- Free Cash Flow — cash remaining after capital expenditures, available for growth or distribution
- Return on Invested Capital (ROIC) — how efficiently your organization converts capital into profitable returns
These are the numbers that investors, boards, and analysts demand. They're important. But tracking them in isolation is like reading only the final chapter of a novel and assuming you understand the whole story.
"What you choose to measure shapes what your organization prioritizes. The wrong metrics don't just give you bad information — they actively reward the wrong behaviors."
The real power of growth metrics comes not from monitoring high-level outputs but from understanding the cause-and-effect chains beneath them. When EBITDA suddenly contracts, do you know which operational variable shifted first? Without that granularity, you're managing consequences, not causes.
Decoding core financial growth metrics
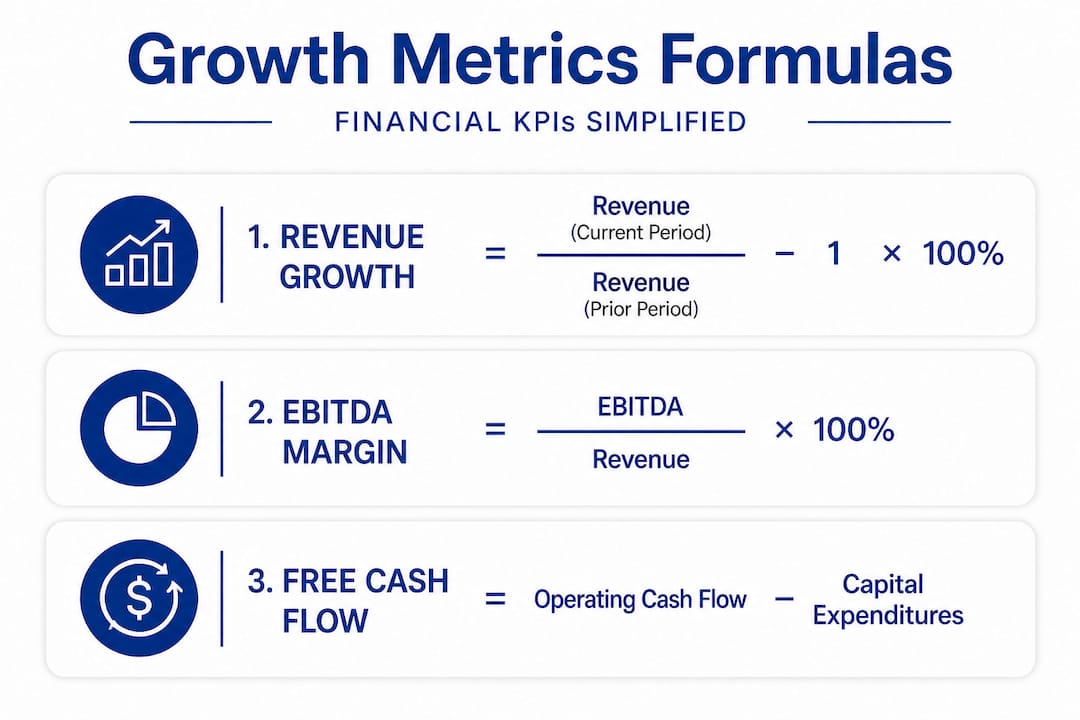
Understanding the formula behind each metric removes the ambiguity that slows executive decisions. Let's break down the most critical numbers and what they actually tell you.
Revenue Growth Rate is calculated as [(Current Period Revenue minus Previous Period Revenue) divided by Previous Period Revenue] multiplied by 100. If your organization grew from $100M to $130M in a year, your growth rate is 30%. Year-over-year comparison is preferred because it eliminates seasonal distortion. For multi-year performance, Compound Annual Growth Rate smooths out the spikes and troughs for a more honest trajectory.
Here's a quick reference for how the main financial growth metrics compare in purpose and calculation:
| Metric | What it measures | Calculation basis | Best used for |
|---|---|---|---|
| Revenue Growth Rate | Top-line expansion speed | YoY or CAGR | Growth trajectory |
| EBITDA Margin | Core operating profitability | EBITDA / Revenue | Operating efficiency |
| Net Profit Margin | Overall profitability | Net Income / Revenue | Bottom-line health |
| Free Cash Flow | Capital available for reinvestment | Operating CF minus CapEx | Strategic agility |
| ROIC | Capital allocation efficiency | NOPAT / Invested Capital | Investment quality |
To read these metrics with real insight, follow this sequence:
- Establish your baseline. Pull three to five years of data for each metric so you can identify trends rather than reacting to single-period noise.
- Compare to industry benchmarks. A 12% net profit margin looks healthy in manufacturing but mediocre in software. Context changes everything.
- Look for divergence. If revenue growth is climbing while free cash flow is shrinking, that's a signal worth investigating before it becomes a crisis.
- Correlate across metrics. ROIC declining while revenue grows often means you're deploying capital into lower-quality opportunities. Leadership KPI patterns like these are what high-performing leadership teams use to detect strategic drift early.
- Set review cadences. Monthly for cash flow, quarterly for margin trends, annually for ROIC and CAGR.
Pro Tip: Never make strategic decisions based on a single quarter's data. Smooth your metrics with year-over-year or rolling three-year averages to distinguish genuine momentum from seasonal noise or one-time events.
Hidden traps: context, scale, and the Rule of 40
Mastering the calculations is only half the work. The other half is understanding when those numbers mislead you, and they will if you're not careful.
The base effect is one of the most underappreciated distortions in growth reporting. A startup growing from $1M to $2M achieves 100% revenue growth. A mature enterprise growing from $5B to $5.5B achieves 10%. Which is more impressive? That depends entirely on context. High % growth becomes harder at scale simply because the denominator is enormous. When executives compare their organization's growth rate to earlier-stage competitors, they're often comparing incompatible situations.
Consider Nvidia's trajectory in recent years. Their absolute revenue gains in dollar terms have been staggering, even as the percentage growth rate moderated. If you evaluated Nvidia purely on percentage change, you might draw the wrong conclusion entirely. Absolute growth in dollars often tells a more honest story at scale.
| Growth context | % Growth | Absolute growth | What it signals |
|---|---|---|---|
| Early-stage startup | 150% | $1.5M | High velocity, small base |
| Mid-market company | 25% | $25M | Healthy expansion |
| Large enterprise | 8% | $400M | Massive absolute gain |
| SaaS scaleup | 35% + 10% margin | Combined 45% | Rule of 40 compliant |
For SaaS and high-growth technology companies, the Rule of 40 provides a more balanced framework. The rule states that your revenue growth rate plus your profit margin should equal or exceed 40%. A company growing at 30% with a 15% margin scores 45, which signals operational health. A company growing at 60% but burning cash at negative 25% scores only 35, which raises sustainability questions. This framework forces leaders to think about growth and profitability together rather than celebrating top-line expansion while ignoring cost discipline.
Benchmarking is equally important. A 15% EBITDA margin in logistics is exceptional. In enterprise software, it's a warning sign of over-investment. Before judging your numbers, know your peer group. Thinking carefully about how many KPIs your organization really needs often starts with clarifying which comparisons are actually relevant.
Pro Tip: Always annotate growth charts with market context notes: acquisitions, pricing changes, macro conditions, competitive entries. A number without context is a story without characters.
Beyond finance: The vital role of human and meaning metrics
Here is where most executive measurement frameworks have a critical blind spot. Financial metrics are lagging indicators. They tell you what already happened. By the time they move, the operational or cultural shift that caused them happened months earlier.

Leading indicators live in the human layer of your organization. Leading vs. lagging metrics represent a fundamentally different approach to organizational monitoring: lagging financial KPIs measure what was, while human and meaning metrics signal what's coming.
Key leading indicators worth tracking include:
- Internal Net Promoter Score (NPS) — how likely employees are to recommend the organization as a place to work, which predicts retention and recruitment quality
- Employee engagement scores — measured quarterly through structured surveys, these track discretionary effort and commitment levels
- Communication velocity — how quickly information moves across teams and functions, a proxy for organizational agility
- Colleague helping frequency — how often team members voluntarily support peers outside their direct scope, a cultural health signal
- Manager effectiveness ratings — upward feedback on direct managers, which often predicts team turnover six to twelve months before it occurs
"The metrics that predict your future performance are usually invisible in your finance team's reports. You have to build separate systems to surface them."
The practical challenge is tracking these without introducing subjective bias. Use structured, anonymous survey tools with fixed question formats. Track trends over time rather than absolute scores. A drop of five points in internal NPS over two consecutive quarters matters far more than whether your absolute score is 42 or 47. Connecting these signals to your KPI failure patterns often reveals that the KPIs that fail are precisely the ones disconnected from human behavior.
From measurement to action: Turning growth metrics into decisions
Data without action is just overhead. The executive teams that outperform their peers don't necessarily have better data. They have better processes for converting data into decisions. Here is how the most effective organizations structure that cycle.
- Define thresholds before you measure. Before you start tracking any metric, establish clear thresholds: green means performance is on target, yellow means attention required, red means immediate intervention. Without pre-set thresholds, you'll spend your review meetings debating whether the number is bad rather than deciding what to do about it.
- Review at the right cadence. Operational metrics like task completion rates and cycle times should be reviewed weekly. Financial metrics like margin and cash flow suit monthly or quarterly review. Strategic metrics like ROIC and CAGR belong in quarterly executive sessions.
- Pair hard data with qualitative context. A dashboard reading is a starting point, not a conclusion. When a metric crosses into red, the next step is a structured conversation with the relevant team leader to understand the operational story behind the number.
- Close the loop explicitly. Every metric that triggers an intervention should be assigned an owner, a corrective action, and a re-review date. This prevents the common pattern where executives identify a problem, discuss it vigorously, and then move on without any resolution.
"Growth metrics, when paired with operational insights and culture data, drive real performance improvement — not just better reporting."
Pairing your measurement system with weekly KPI tracking discipline at the team level closes the gap between executive visibility and ground-level reality. When your teams update their KPIs consistently, your executive dashboard reflects the truth, not a lagging summary.
Consider a practical example. An executive team notices that free cash flow is tightening over three consecutive quarters even though revenue is growing. By correlating this with operational data, they discover that sales cycle length has increased, extending the time between contract signing and cash receipt. That insight leads to a targeted intervention in the sales operations process, not a broad cost-cutting program that would have damaged the team.
The overlooked art: Choosing what not to measure
Here is the perspective most growth measurement articles will never share with you: the organizations that make the best decisions are often tracking fewer metrics, not more.
There's a seductive logic to measurement expansion. Every new operational question seems to justify a new KPI. Over time, executive dashboards accumulate dozens of metrics, weekly reports run to 30 slides, and leadership teams spend more time interpreting data than acting on it. This is measurement theater, not management.
Elite organizations practice what we might call chosen ignorance. They deliberately decide what not to track. This isn't laziness. It's strategic discipline. Every metric on your dashboard costs attention, analysis time, and organizational bandwidth. A metric that doesn't connect to a decision you might actually make is noise that crowds out the signal.
The hard-won lesson is this: every metric you add to your executive review should earn its place by answering a specific question that changes how you allocate resources or set priorities. If you can't articulate what decision a metric informs, it shouldn't be on your dashboard.
A practical framework for this is the quarterly metric review. Once every quarter, your leadership team should evaluate every tracked metric against three options: keep (it's actively shaping decisions), rethink (it's tracked but rarely acted on), or kill (it's creating noise without generating insight). Most teams find that 20 to 30 percent of their tracked metrics fall into the kill category once they apply this test honestly.
Setting the right KPI thresholds is also part of this discipline. A metric without a well-defined threshold is just a number. The combination of fewer, better-chosen metrics and rigorously calibrated thresholds is what separates organizations that respond intelligently from those that simply react to every fluctuation.
Level up your metrics strategy with Outsprinter
The frameworks and insights in this article only create value when they're embedded into your organization's daily operating rhythm — not just discussed in a quarterly offsite.
Outsprinter is built specifically for executive teams who want to move from scattered spreadsheets to a unified performance system. With the KPI Management module, you can define, visualize, and track every metric covered in this article across all departments in real time. The Outsprinter platform connects KPI performance to task execution through Task Management, so when a metric signals a problem, your team can assign corrective actions immediately, close the loop, and track resolution without switching tools. This is how measurement becomes movement.
Frequently asked questions
Which growth metrics matter most for executive decision-making?
Revenue Growth Rate, EBITDA Margin, Net Profit Margin, Free Cash Flow, and ROIC form the financial core, but pairing these with leading human-centered metrics like employee engagement and internal NPS significantly sharpens strategic decisions.
How do you calculate annual Revenue Growth Rate?
Subtract last year's revenue from this year's, divide that difference by last year's revenue, and multiply by 100. For example, a move from $100M to $130M represents a 30% growth rate, best evaluated year-over-year to avoid seasonal distortion.
What is the Rule of 40 in SaaS?
The Rule of 40 states that a healthy SaaS company's growth rate plus margin should total at least 40%, balancing top-line expansion against profitability sustainability.
Why do human and meaning metrics matter for growth?
Leading indicators like engagement and communication velocity typically signal organizational acceleration or decline months before lagging financial KPIs reflect any change, giving executives time to act rather than react.