
You've run the workshops, set the goals, and pushed for better results. Yet somehow, team performance stays stuck. This frustration is more common than most leaders admit, and it rarely comes from a lack of effort. It comes from a lack of structure. Research shows that HPWPs in SMEs boost performance, reduce turnover, and increase motivation when applied with intention. This guide walks you through a practical, evidence-based process: assess your starting point, set meaningful KPIs, embed high-performance practices, and verify that your changes are actually working. Practical solutions exist at every stage.
Table of Contents
- Assessing your team's starting point
- Setting clear goals with KPIs and tasks
- Implementing high-performance team practices
- Monitoring progress and adapting for results
- A different take: Why real team improvement demands less, not more, process
- Ready to transform your team's performance?
- Frequently asked questions
Key Takeaways
| Point | Details |
|---|---|
| Start with a baseline | Evaluating your team’s current state ensures your improvement plan is focused and effective. |
| Focus your KPIs | Limit tracked KPIs to 3-5 per project to keep your team focused and motivated. |
| Adopt what works | Implement high-performance practices one at a time for lasting impact on engagement and results. |
| Monitor and adapt | Regularly check results and refine your methods based on feedback and data. |
| Simpler is stronger | Streamlining your process often drives better team performance than adding more tools or steps. |
Assessing your team's starting point
Before you can map a path to improvement, you need to understand your team's true starting position. Most leaders skip this step, jumping straight to solutions before they've diagnosed the real problem. That's like prescribing medicine before running any tests.
Start by looking at the signals your team is already sending. High turnover, frequent absenteeism, unclear role ownership, and low participation in meetings are all warning signs. They don't always mean people are disengaged by choice. Often they reflect structural gaps: unclear expectations, poor feedback loops, or misaligned priorities.
Here are the key areas to benchmark before you act:
- Engagement score: Are team members actively contributing ideas and taking ownership?
- Turnover rate: How many people have left in the past 12 months compared to your industry average?
- Absenteeism rate: Frequent unplanned absences often signal disengagement or burnout.
- Project completion rate: What percentage of projects finish on time and within scope?
- Innovation indicators: Are team members suggesting improvements, or just executing tasks?
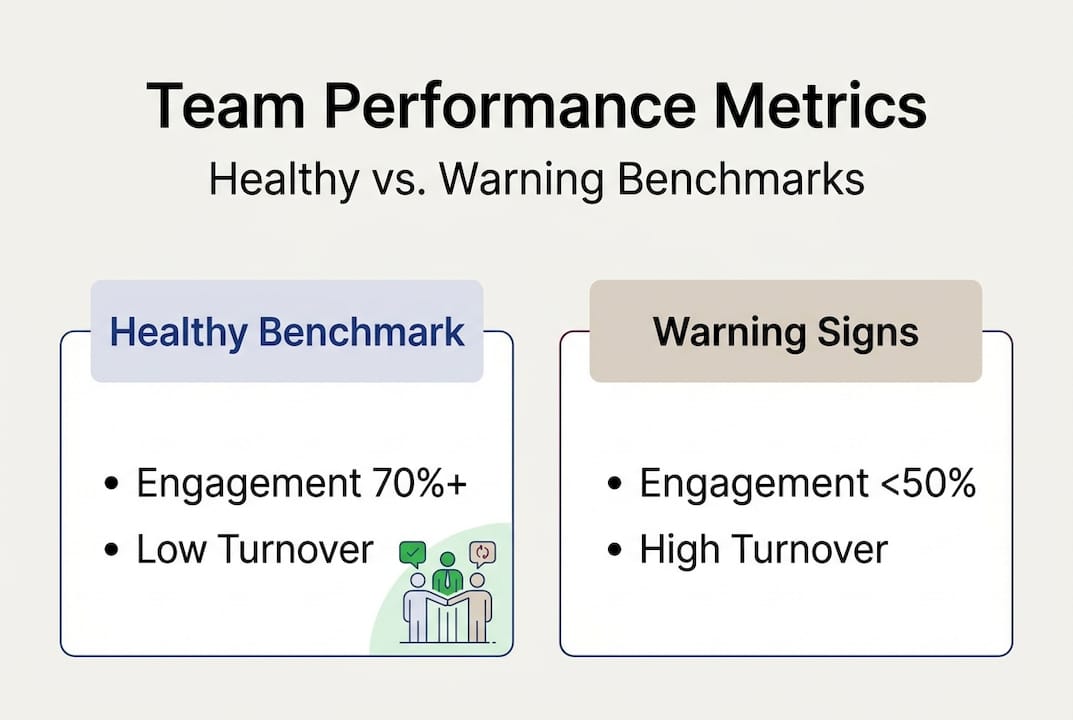
| Metric | Healthy benchmark | Warning threshold |
|---|---|---|
| Engagement score | Above 70% | Below 50% |
| Annual turnover | Under 15% | Above 25% |
| Absenteeism rate | Under 3% | Above 6% |
| Project completion rate | Above 80% | Below 60% |
| New ideas submitted | Monthly | Quarterly or less |
Reviewing these numbers gives you a factual baseline rather than a gut feeling. Once you have it, you can reference best practices for leadership teams to identify which levers to pull first.
Pro Tip: Don't rely solely on your own observations. Use anonymous surveys to collect honest feedback from the team. People share things in writing that they won't say in a meeting, and that candor is exactly what you need to build an accurate picture.
A solid team management checklist can also help you structure this assessment phase so nothing critical gets missed.
Setting clear goals with KPIs and tasks
Once you've established your baseline, the next step is to identify what you want the team to achieve and how you'll measure progress. Vague goals are one of the most underrated performance killers. "Improve customer satisfaction" sounds reasonable until no one agrees on what improvement looks like or when it's been achieved.

SMART goals fix this. Specific, Measurable, Achievable, Relevant, and Time-bound targets give everyone the same definition of success. But SMART goals alone aren't enough. You need KPIs that connect daily work to those goals, and tasks that connect KPIs to individual actions.
Here's a simple process to align all three:
- Define the outcome. What does success look like in 90 days? Be specific: "Reduce average task completion time from 5 days to 3 days."
- Choose 3 to 5 KPIs. Pick indicators that directly reflect progress toward that outcome. For example: task completion rate, rework percentage, and team velocity.
- Break KPIs into weekly tasks. Each KPI should map to at least one recurring action. If you're tracking rework percentage, assign a weekly quality review task.
- Assign ownership. Every KPI and every task needs a named owner. Shared ownership often means no ownership.
- Review weekly. A short weekly check-in keeps KPIs visible and gives you early warning when something drifts.
Studies show that HPWPs enhance engagement and motivation when teams have clarity on what they're working toward and why it matters. Reviewing performance metrics examples can help you choose indicators that actually reflect team output rather than just activity.
Pro Tip: Limit active KPIs to 3 to 5 per project. More than that and attention gets fragmented. Teams start optimizing for the metric that feels easiest, not the one that matters most.
Understanding the value of measuring team performance also helps you make the case to your team for why these numbers matter, which increases buy-in.
Implementing high-performance team practices
With goals and KPIs in place, it's time to action change by embedding practices proven to raise performance. High-performance work practices, or HPWPs, are specific behaviors and systems that shift how teams operate day to day. They're not abstract concepts. They show up as concrete habits.
In practice, HPWPs look like this: team members share ownership of outcomes rather than just tasks, feedback happens in real time rather than at annual reviews, and task progress is visible to everyone rather than siloed in individual inboxes. These shifts matter because HPWPs reduce absenteeism and turnover while also driving innovation.
| Common team practice | High-performance alternative | Expected outcome |
|---|---|---|
| Annual performance reviews | Monthly KPI check-ins | Faster course correction |
| Manager-assigned tasks | Shared task ownership | Higher accountability |
| Email-based updates | Transparent task tracking | Reduced miscommunication |
| Reactive problem-solving | Weekly feedback loops | Fewer recurring issues |
| Large project teams | Teams of around 9 | Stronger engagement |
Rolling out all of these at once is a mistake. Instead, follow this sequence:
- Pick one practice. Start with the change most likely to produce a visible result quickly, such as switching to weekly KPI reviews.
- Run it for 30 days. Give the practice enough time to become a habit before evaluating it.
- Measure the impact. Did the targeted metric improve? By how much?
- Expand or adjust. If it worked, add a second practice. If it didn't, diagnose why before moving on.
Team size also matters more than most leaders realize. Research shows that teams larger than 20 show a weaker link between engagement and productivity, while the optimal size for software development teams is around 9. If your team is large, consider breaking it into smaller, focused units. Staying current on performance management trends and reviewing Agile sprint management best practices can help you avoid common adoption pitfalls.
Monitoring progress and adapting for results
Adopting new practices is just the beginning. Verifying impact and learning as you go is essential for long-term improvement. Many leaders implement changes and then move on to the next initiative before confirming the first one actually worked. That's how teams end up with layers of processes that no one can explain.
Here are the clearest signals that your improvements are taking hold:
- Projects are completing faster and with fewer last-minute scrambles.
- Error and rework rates are trending down.
- Team members are raising issues earlier rather than waiting for them to become crises.
- Engagement scores are rising, even modestly.
- Voluntary turnover is declining.
When signals are mixed or negative, go back to your KPIs before changing anything else. A drop in one metric often points to a specific breakdown in process or ownership. Fix the root cause, not the symptom.
Teams that skip the adaptation step often see early gains evaporate within 60 to 90 days. Improvement is not a one-time event. It's a feedback loop.
One of the most avoidable performance drains is poor backlog management. Agile fails from backlog chaos, dependency blindness, and lack of ownership. These issues can cost teams up to 20% of their productive capacity without anyone noticing because the losses accumulate slowly.
Using performance visualization techniques makes trends visible before they become problems. And if you want a framework for structuring your review cadence, leadership performance methods offer proven approaches for keeping teams accountable without micromanaging.
A different take: Why real team improvement demands less, not more, process
Here's something most performance guides won't tell you: adding more tools and processes is often the reason teams plateau. Leaders respond to stalled performance by layering on new systems, frameworks, and meetings. The team ends up spending more time managing the improvement process than actually doing the work.
The research on high-performance practices points toward clarity and focus, not volume. The teams that improve fastest are usually the ones that ruthlessly cut what isn't working rather than constantly adding to the pile.
"Complexity is the enemy of execution. The best-performing teams are not the ones with the most sophisticated systems. They're the ones that do fewer things, consistently."
This is worth sitting with. Before you introduce another KPI or schedule another review, ask what you can remove. Explore team execution rhythms for a practical model built on focus rather than overload.
Pro Tip: Try subtraction. Remove one recurring meeting or one underused tool, and track what happens to team output over the next 30 days. The results often surprise leaders who assumed more structure always meant better performance.
Ready to transform your team's performance?
If the strategies in this guide resonate, the next challenge is execution. Tracking KPIs manually, managing tasks across spreadsheets, and running performance reviews without real-time data makes the whole process harder than it needs to be.
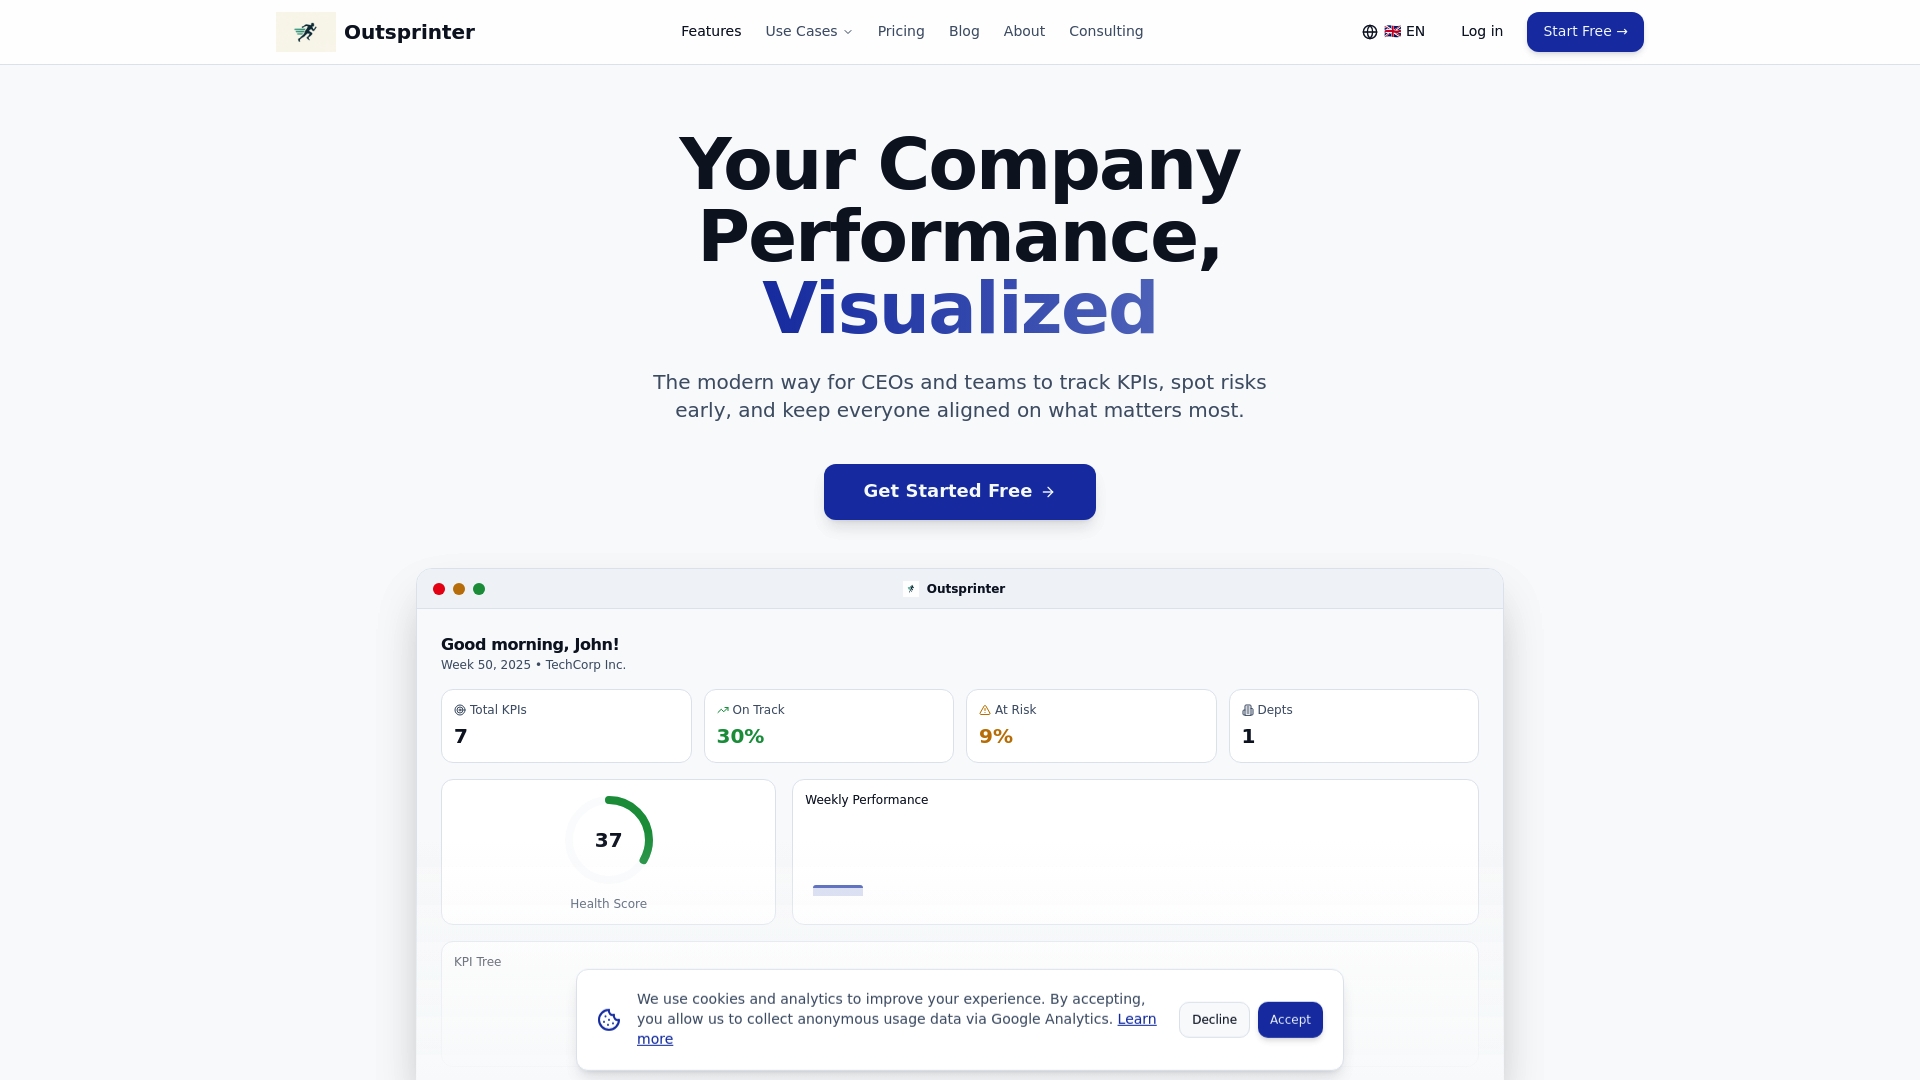
Outsprinter is built specifically for teams like yours. You can manage tasks with Outsprinter using priorities, deadlines, and subtasks that keep everyone aligned. The KPI tracking tools let you define, visualize, and monitor performance indicators across your entire organization in real time. From goal planning to workload analysis, every feature connects back to the strategies covered in this guide, so you spend less time chasing data and more time leading.
Frequently asked questions
What's the most effective way to start improving team performance?
Begin by assessing current strengths and weaknesses using engagement scores, turnover rates, and project completion data, then set specific goals backed by clear KPIs. HPWPs boost performance and motivation most effectively when built on an honest baseline.
How many KPIs should a team track at once?
Most teams perform best when focused on 3 to 5 KPIs per project. Tracking more than that fragments attention and often leads teams to optimize for the easiest metric rather than the most important one.
What team size is best for high performance?
Teams of around 9 members tend to balance engagement and productivity most effectively. Research shows that teams larger than 20 show a weaker link between engagement and output.
How do I know if my team practices are working?
Look for lower turnover, higher engagement scores, and faster project completion as your primary indicators. HPWPs reduce turnover and absenteeism while boosting engagement when applied consistently over time.